. 2014 Jul;42(7):536-46.e8.
doi: 10.1016/j.exphem.2014.03.006. Epub 2014 Apr 2.

Extensively self-renewing erythroblasts derived from transgenic β-yac mice is a novel model system for studying globin switching and erythroid maturation

Affiliations

Extensively self-renewing erythroblasts derived from transgenic β-yac mice is a novel model system for studying globin switching and erythroid maturation

Michael Getman et al. Exp Hematol. 2014 Jul.

Abstract

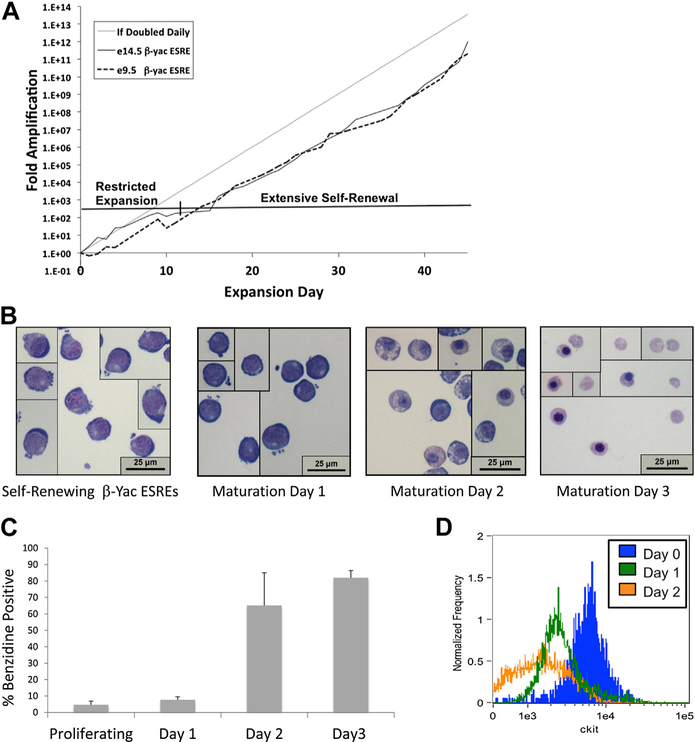
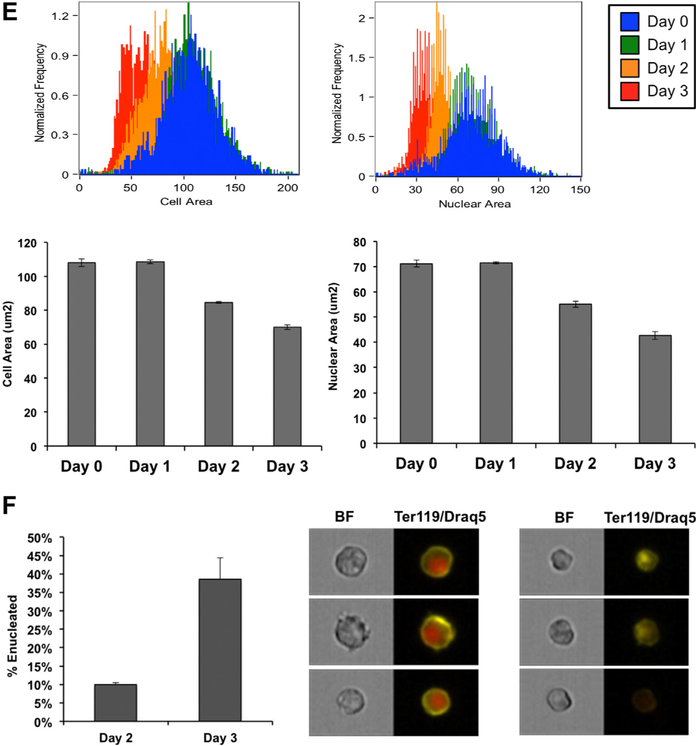
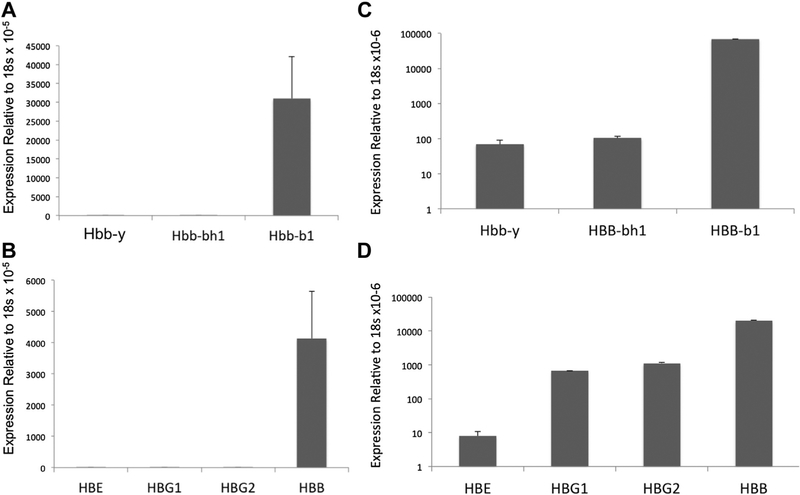
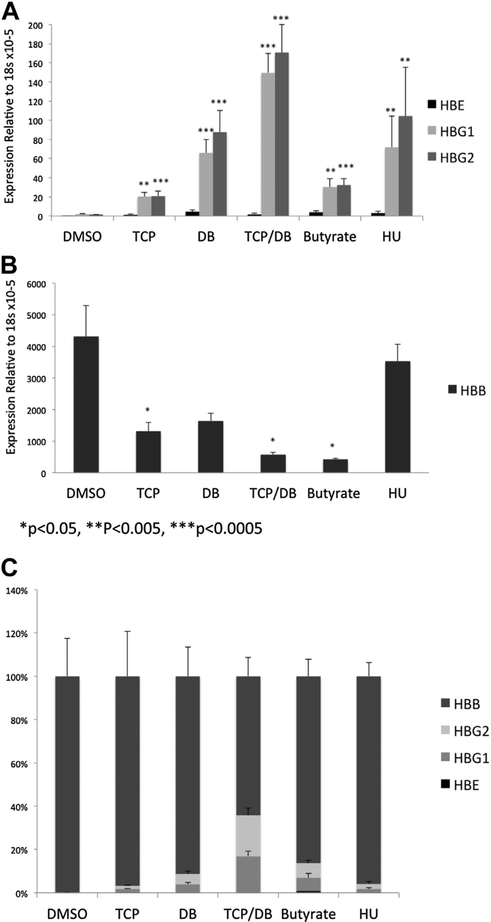
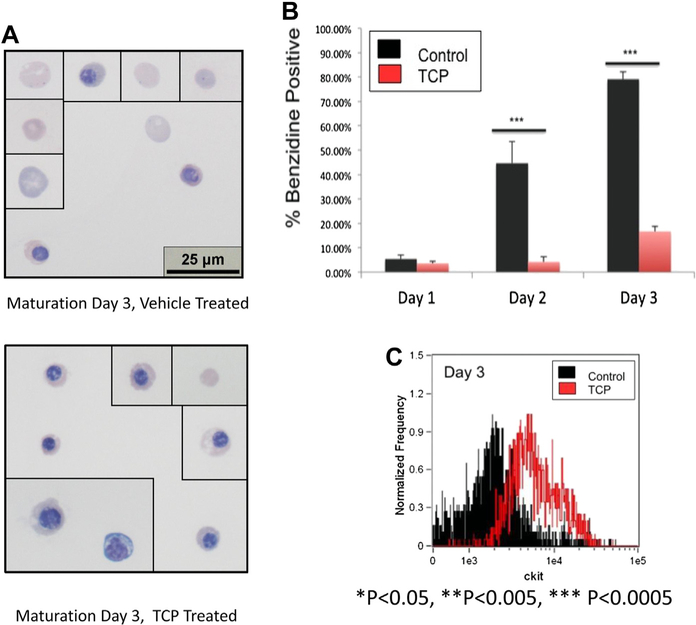
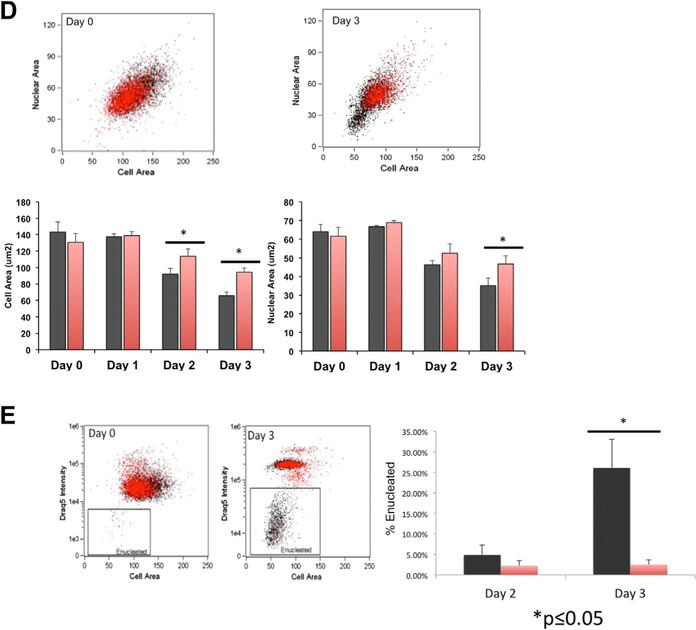
Globin gene regulation occurs in the context of a maturing erythroid cell, which is undergoing significant changes in chromatin structure and gene expression. There are few model systems available that facilitate studies of globin gene regulation in the context of erythroid maturation. Extensively self-renewing erythroblasts (ESREs) are a nontransformed model of erythroid maturation derived from murine fetal liver or yolk sac. Imaging flow cytometry and RNA-seq studies demonstrate that ESREs functionally and molecularly model erythroid maturation. To address the need for a model system that also recapitulates human globin switching, ESREs were derived from mice transgenic for the complete human β-globin locus (β-yac ESREs). β-yac ESREs express β-globin from the transgenic human locus, with minimal γ-globin expression. When treated with hydroxyurea or inhibitors to histone deacetylases, DNA methyltransferases, or the histone demethylase lysine specific demethylase 1 (LSD1), β-Yac ESREs significantly increase their γ-globin expression, demonstrating their utility for studying agents that influence maturational globin switching. β-yac ESREs were further used to characterize the secondary effects of LSD1 inhibition on erythroid maturation, with inhibition of LSD1 resulting in altered cell and nuclear size, prolonged Kit expression, and decreased rates of enucleation consistent with impaired maturation. Taken together, these studies demonstrate that β-yac ESREs have significant utility for identifying modulators of maturational globin switching as well as for studying the broader role of those modulators in erythroid maturation.


Conflict of interest statement

Conflict of interest disclosure

No financial interest/relationships with financial interest relating to the topic of this article have been declared.

Figures

Figure 1.
Figure 1.
β-yac ESREs model terminal erythroid maturation. (A) Similar to nontransgenic ESREs, β-yac ESREs derived from both e9.5 yolk sac and e14.5 fetal liver demonstrate a period of restricted proliferation before the establishment of extensive self-renewal. (B) Photomicrographs of self-renewing and maturing β-ESREs. Self-renewing β-yac ESREs (left panel) resemble proerythroblasts. Middle panels are representative images of β-yac ESRE cultures during the first 2 days of maturation. After 3 days in maturation media (right panel), the culture is composed primarily of late-stage erythroid precursors and enucleated erythrocytes. (C) Benzidine staining of β-yac ESREs. After 3 days, the majority of the culture is benzidine positive. (D) Imaging flow cytometry demonstrates that maturation of β-yac ESREs is associated with loss of Kit expression. (E) Imaging flow cytometry demonstrates that maturation of β-yac ESREs is associated with a progressive decrease in cell and nuclear size. Upper panels are representative histograms. Lower panels represent mean and SEM of three independent experiments. (F) Percent of enucleated cells, determined by comparing DRAQ intensity to cell area. After 2 days of maturation, approximately 10% of cells are enucleated. After 3 days of maturation, approximately 40% of cells are enucleated. Data are mean and SEM of three independent experiments. Images of nucleated (center panel) and enucleated (right panel) cells from imaging flow cytometer are shown. Ter119 staining is yellow and DRAQ5 staining is red. BF = Bright Field; e = embryonic day.
Figure 1.
Figure 1.
β-yac ESREs model terminal erythroid maturation. (A) Similar to nontransgenic ESREs, β-yac ESREs derived from both e9.5 yolk sac and e14.5 fetal liver demonstrate a period of restricted proliferation before the establishment of extensive self-renewal. (B) Photomicrographs of self-renewing and maturing β-ESREs. Self-renewing β-yac ESREs (left panel) resemble proerythroblasts. Middle panels are representative images of β-yac ESRE cultures during the first 2 days of maturation. After 3 days in maturation media (right panel), the culture is composed primarily of late-stage erythroid precursors and enucleated erythrocytes. (C) Benzidine staining of β-yac ESREs. After 3 days, the majority of the culture is benzidine positive. (D) Imaging flow cytometry demonstrates that maturation of β-yac ESREs is associated with loss of Kit expression. (E) Imaging flow cytometry demonstrates that maturation of β-yac ESREs is associated with a progressive decrease in cell and nuclear size. Upper panels are representative histograms. Lower panels represent mean and SEM of three independent experiments. (F) Percent of enucleated cells, determined by comparing DRAQ intensity to cell area. After 2 days of maturation, approximately 10% of cells are enucleated. After 3 days of maturation, approximately 40% of cells are enucleated. Data are mean and SEM of three independent experiments. Images of nucleated (center panel) and enucleated (right panel) cells from imaging flow cytometer are shown. Ter119 staining is yellow and DRAQ5 staining is red. BF = Bright Field; e = embryonic day.
Figure 2.
Figure 2.
Quantitative PCR demonstrates that β-yac ESREs express adult globins, both from the endogenous murine beta globin locus and the transgenic human beta globin locus. Data on globin expression is presented from three independent transgenic cultures and from three independent cultures derived from nontransgenic littermate controls. (A) Murine globin expression in maturing β-yac ESREs. (B) Human globin expression in maturing β-yac ESREs. Only the adult globin, HBB, is expressed at significant levels. (C) At e12.5, the fetal liver contains maturing definitive erythroid cells, as well as circulating primitive erythrocytes [36]. In contrast to β-yac ESREs, quantitative PCR demonstrates that both embryonic and adult murine globins are detected in unsorted, uncultured e12.5 β-yac fetal liver. (D) The embryonic, fetal, and adult human globins are also detected in unsorted, uncultured e12.5 β-yac fetal liver. Hbb−y = hemoglobin Y, β-like embryonic chain; Hbb-bh1 = hemoglobin Z, β-like embryonic chain; Hbb-b1 = hemoglobin, β adult major chain; HBG1 = hemoglobin, Gamma A (γA); HBG2 = hemoglobin, Gamma G (γG).
Figure 3.
Figure 3.
ESREs have gene expression changes consistent with terminal erythroid maturation. (A) Heat map of genes with significant changes in expression during maturation of ESREs, demonstrating that the majority of genes are downregulated with maturation. (B) Top network identified by Ingenuity Pathway Analysis of genes upregulated during ESRE maturation.
Figure 4.
Figure 4.
Inhibitors to HDACs, DNMTs, and LSD1 alter globin expression in β-yac ESREs. Error bars represent standard error of a minimum of three independent experiments. (A) Inhibitors to chromatin modifiers induce γ-globin expression in β-yac ESREs. β-yac ESREs were placed in maturation media with either vehicle control (dimethyl sulfoxide), TCP, DB, a combination of TCP and DB (TCP/DB), sodium butyrate, or HU for 24 hours. Then, globin expression was assessed by quantitative PCR. Light grey bars represent HBG1 expression, dark grey bars represent HBG2 expression, and black bars represent HBE expression. A statistically significant increase in gamma globin expression was seen in all treatment conditions. (B) β-yac ESREs treated with TCP, DB, and sodium butyrate express less β-globin from the transgenic human locus than vehicle-treated controls. (C) Data are presented as percent of total human globin. Error bars represent SEM of a minimum of three independent experiments. DB = Decitabine; DMSO = dimethyl sulf-oxide; HBB = β-globin; HBE = hemoglobin E; HBG1 = hemoglobin, Gamma A (γA); HBG2 = hemoglobin, Gamma G (γG).
Figure 5.
Figure 5.
Treatment of β-yac ESREs with an LSD1 inhibitor results in abnormal maturation and impaired enucleation. (A) Photomicrographs from vehicle-treated cultures (upper panel) and TCP-treated cultures (lower panel) on day 3 of maturation. The vehicle-treated culture consists of late-stage erythroid precursors and enucleated cells. The TCP-treated cultures are more heterogeneous, with both late-stage erythroid precursors and enucleated cells, as well as less mature erythroid precursors. (B) Benzidine staining of TCP-treated samples (red bars) and vehicle-treated control (black bars). Data represent mean and SEM of a minimum of three independent experiments. (C) Histogram of Kit expression determined by imaging flow cytometry on β-yac ESREs treated with TCP or vehicle control after 3 days of maturation. The Kit levels are higher in the TCP-treated samples than in the vehicle-treated control. (D) Comparison of cell and nuclear size in vehicle- and TCP-treated cells. Vehicle-treated cells are in black, and TCP-treated cells are in red. Graphs represent mean of three independent experiments. After 3 days of maturation, the TCP-treated cells have both a larger cell and nuclear size. (E) TCP treatment impairs enucleation. Vehicle-treated cells are in black, and TCP-treated cells are in red. The percent of enucleated cells was determined by comparing DRAQ5 intensity to cell area. Graph represents mean and SEM of three independent experiments.
Figure 5.
Figure 5.
Treatment of β-yac ESREs with an LSD1 inhibitor results in abnormal maturation and impaired enucleation. (A) Photomicrographs from vehicle-treated cultures (upper panel) and TCP-treated cultures (lower panel) on day 3 of maturation. The vehicle-treated culture consists of late-stage erythroid precursors and enucleated cells. The TCP-treated cultures are more heterogeneous, with both late-stage erythroid precursors and enucleated cells, as well as less mature erythroid precursors. (B) Benzidine staining of TCP-treated samples (red bars) and vehicle-treated control (black bars). Data represent mean and SEM of a minimum of three independent experiments. (C) Histogram of Kit expression determined by imaging flow cytometry on β-yac ESREs treated with TCP or vehicle control after 3 days of maturation. The Kit levels are higher in the TCP-treated samples than in the vehicle-treated control. (D) Comparison of cell and nuclear size in vehicle- and TCP-treated cells. Vehicle-treated cells are in black, and TCP-treated cells are in red. Graphs represent mean of three independent experiments. After 3 days of maturation, the TCP-treated cells have both a larger cell and nuclear size. (E) TCP treatment impairs enucleation. Vehicle-treated cells are in black, and TCP-treated cells are in red. The percent of enucleated cells was determined by comparing DRAQ5 intensity to cell area. Graph represents mean and SEM of three independent experiments.

Similar articles

Cited by

References

    1. Mai A, Jelicic K, Rotili D, et al. Identification of two new synthetic histone deacetylase inhibitors that modulate globin gene expression in erythroid cells from healthy donors and patients with thalassemia. Mol Pharmacol. 2007;72:1111–1123. - PubMed
    1. Cao H, Stamatoyannopoulos G, Jung M. Induction of human gamma globin gene expression by histone deacetylase inhibitors. Blood. 2004; 103:701–709. - PMC - PubMed
    1. Migliaccio AR, Rotili D, Nebbioso A, Atweh G, Mai A. Histone deacetylase inhibitors and hemoglobin F induction in beta-thalassemia. Int J Biochem Cell Biol. 2008;40:2341–2347. - PMC - PubMed
    1. Mabaera R, Richardson CA, Johnson K, Hsu M, Fiering S, Lowrey CH. Developmental- and differentiation-specific patterns of human gamma- and beta-globin promoter DNA methylation. Blood. 2007; 110:1343–1352. - PMC - PubMed
    1. Ley TJ, Anagnou NP, Noguchi CT, et al. DNA methylation and globin gene expression in patients treated with 5-azacytidine. Prog Clin Biol Res. 1983;134:457–474. - PubMed

Publication types