. 2014 Jun 5;14(6):796-809.
doi: 10.1016/j.stem.2014.02.004. Epub 2014 Apr 3.

Modeling ALS with iPSCs reveals that mutant SOD1 misregulates neurofilament balance in motor neurons

Affiliations

Modeling ALS with iPSCs reveals that mutant SOD1 misregulates neurofilament balance in motor neurons

Hong Chen et al. Cell Stem Cell. .

Abstract

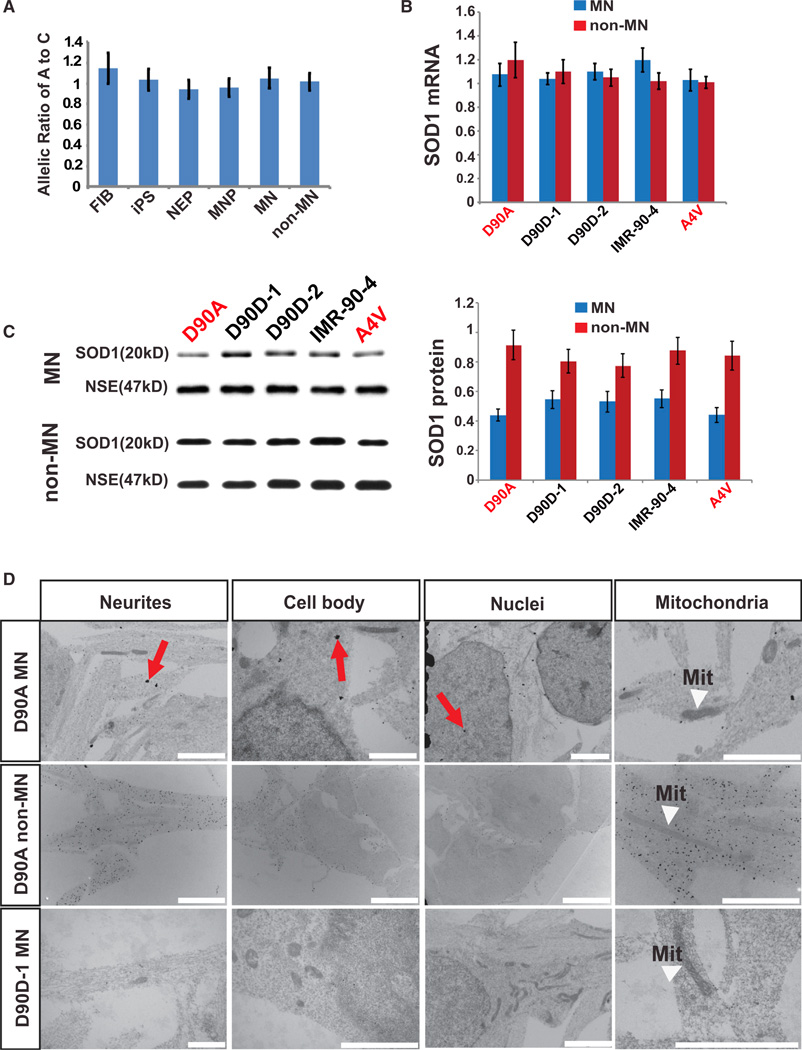
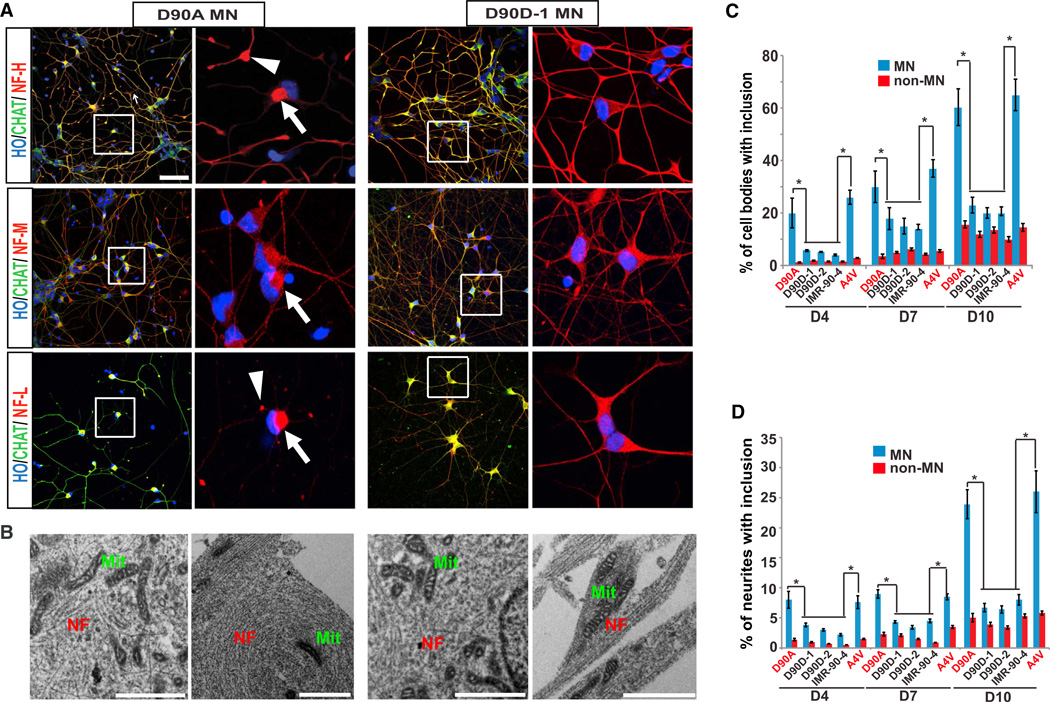
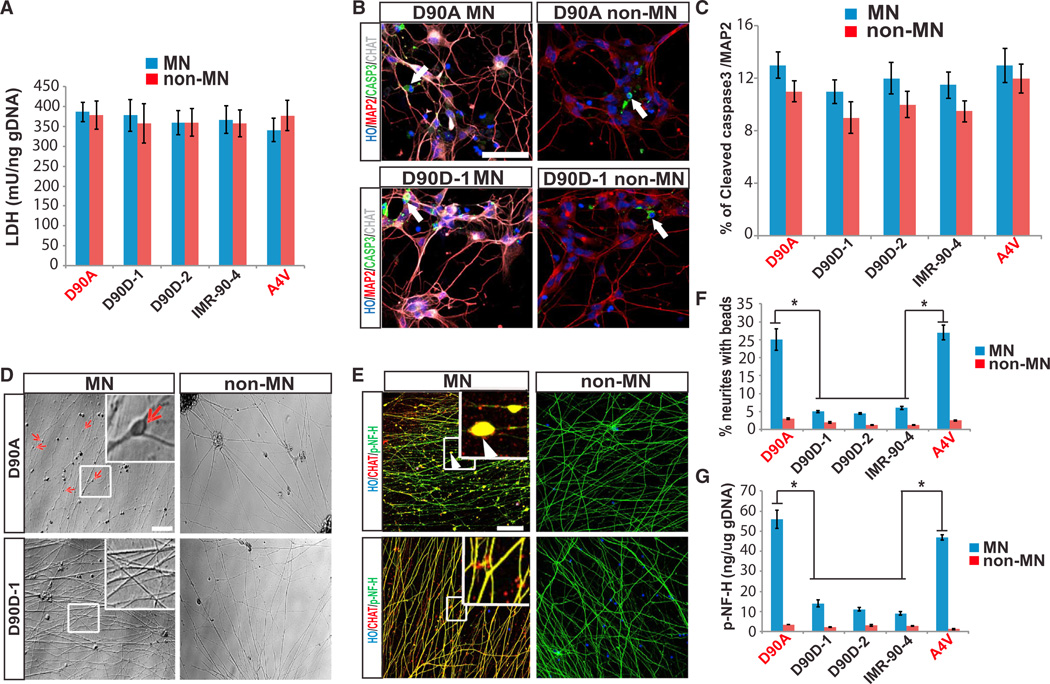
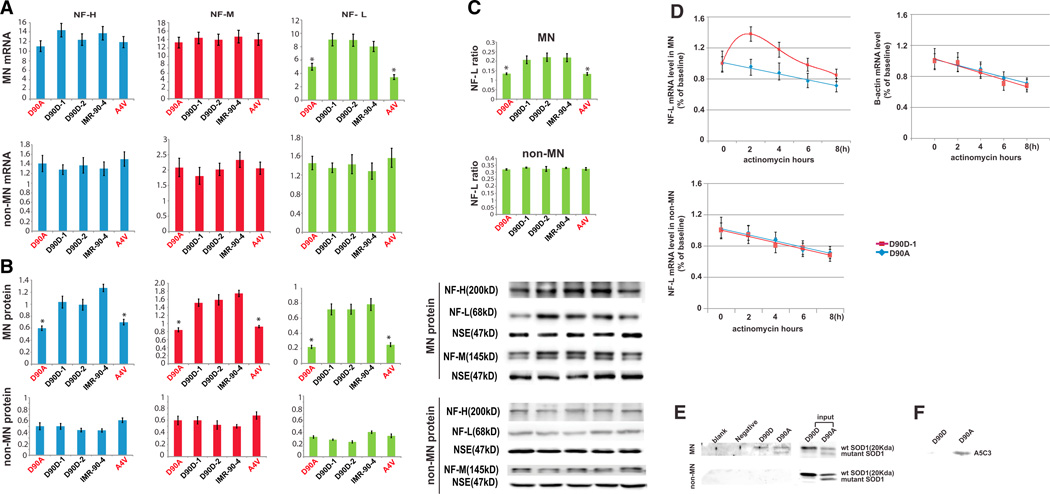
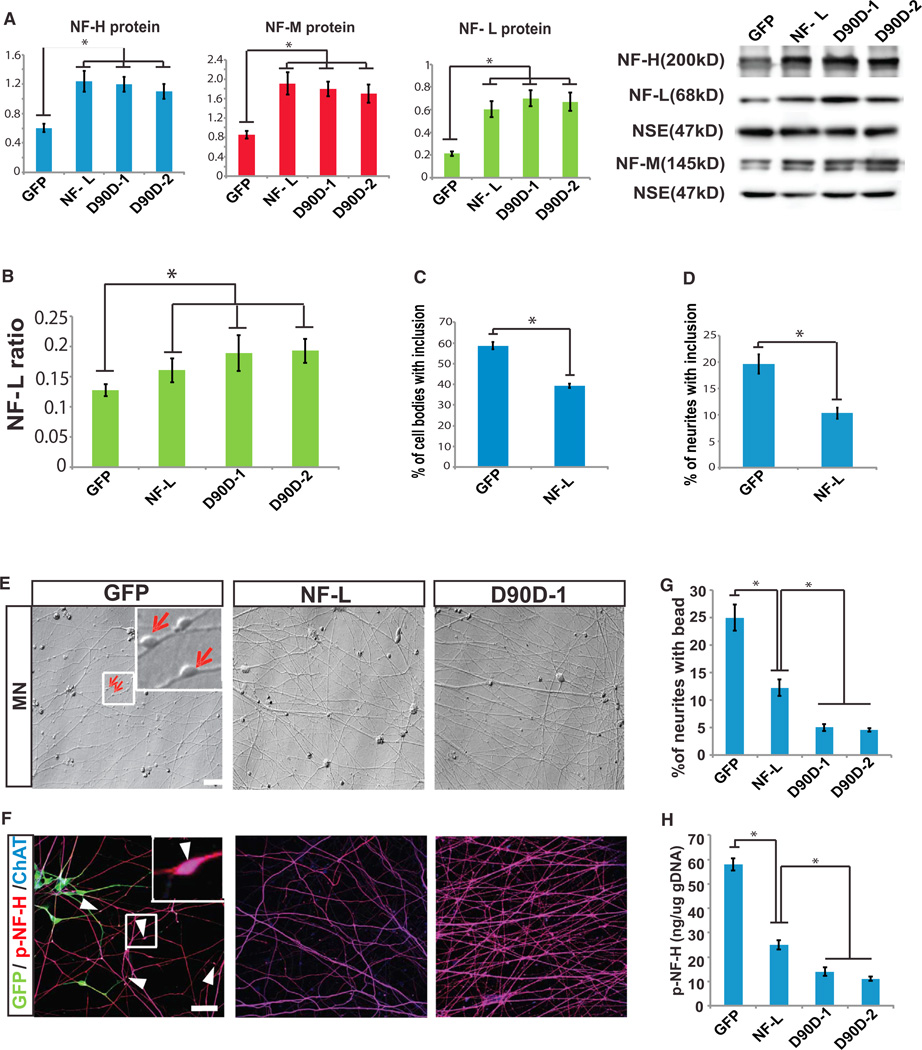
Amyotrophic lateral sclerosis (ALS) presents motoneuron (MN)-selective protein inclusions and axonal degeneration but the underlying mechanisms of such are unknown. Using induced pluripotent cells (iPSCs) from patients with mutation in the Cu/Zn superoxide dismutase (SOD1) gene, we show that spinal MNs, but rarely non-MNs, exhibited neurofilament (NF) aggregation followed by neurite degeneration when glia were not present. These changes were associated with decreased stability of NF-L mRNA and binding of its 3' UTR by mutant SOD1 and thus altered protein proportion of NF subunits. Such MN-selective changes were mimicked by expression of a single copy of the mutant SOD1 in human embryonic stem cells and were prevented by genetic correction of the SOD1 mutation in patient's iPSCs. Importantly, conditional expression of NF-L in the SOD1 iPSC-derived MNs corrected the NF subunit proportion, mitigating NF aggregation and neurite degeneration. Thus, NF misregulation underlies mutant SOD1-mediated NF aggregation and axonal degeneration in ALS MNs.


Figures

Figure 1
Figure 1. iPSC Generation, Neural Differentiation, and Mutation Correction
(A) Contrast image of iPSC colonies. (B) Immunofluorescent image of NANOG expression in D90A SOD1 iPSCs. (C and D) DNA sequencing showing heterozygous nucleotides (A/C) in D90A (C) and homozygous nucleotide A in corrected (D90D) (D) SOD1 iPSCs. (E) Schematic protocol for MN and non-MN differentiation. Human PSCs were differentiated to neuroepithelia (NE) in the presence of three small molecular compounds (3c) for 7 days before being patterned to spinal progenitors for 7 days with morphogens (Pur, purmorphamine; Cyclo, cyclopamine). The progenitors were expanded in suspension for 1 week and then plated onto laminin substrate for differentiation to postmitotic neurons from day 21. (F and G) ALS (D90A) and genetically corrected ALS (D90D-1) iPSCs differentiated to OLIG2+ MN progenitors at day 14, MNX1+ postmitotic MNs at day 21, and CHAT+ maturing MNs at day 28. (H and I) Quantification of TUJ1+ neuronal population among total Hoechst (HO)-labeled cells (H) and MNX1+ MNs among neurons (I). Scale bar = 50 µm. Data are represented as mean ± SEM.
Figure 2
Figure 2. SOD1 Expression and Aggregation in iPSC-Derived Neurons
(A) Allelic imbalance assay showing the ratio of mutant (A) and WT (C) copy of SOD1 transcripts in fibroblasts (FIB), reprogrammed stem cells (iPS), their differentiated neuroepithelia (NEP), MN progenitors (MNP), MNs, and non-MNs. (B) RT-qPCR analysis showing SOD1 mRNA expression in MNs and non-MNs. (C) Representative western blots and relative SOD1 expression levels (to neuron-specific enolase) in MNs and non-MNs. (D) SOD1 immuno-EM in neurites, cytoplasm, nuclei, and mitochondria of MN and non-MN cultures. Arrows indicate clusters of gold particles. No contrast staining for ALS non-MNs for better view of fine gold particles. Scale bar = 2 µm. Data are represented as mean ± SEM.
Figure 3
Figure 3. NF Inclusions in ALS iPSC-Derived Neurons
(A) Immunofluorescent images of NF-H, NF-M, and NF-L in CHAT+ MNs. NF staining in the insets is magnified on the right panel. Arrows indicate NF inclusions in the cell body; arrowheads indicate NF inclusions in neurites. Scale bar = 50 µm. (B) EM showing NF arrangement in cell body (left) and neurites (right) of MN cultures. Scale bar = 2 µm. (C and D) Quantification of NF inclusion-containing cell bodies (C) and neurites (D) in MNs and non-MNsat day 4,7, and 10 after plating. Data are represented as mean ± SEM, *p < 0.05. 150–200 neurons and 500 neurites per cell line were counted.
Figure 4
Figure 4. Degenerative Changes in ALS MN Neurites
(A) Colorimetric measurement of LDH (normalized to gDNA) in culture media from MN and non-MN cultures. (B and C) Cleaved caspase-3 staining (arrows) and quantification. (D) Phase contrast images of MNs and non-MNs at day 10. Arrows indicate bead-like swellings in neurites. Inset is magnified in upper right. (E) Immunofluorescent images of p-NF-H in MNs and non-MNs. Arrowheads indicate bead-like structures in neurites. Inset magnified in upper right. (F) Quantification of beads on neurites. (G) ELISA quantification of p-NF-H in media (normalized to gDNA). *p < 0.01. Scale bar = 50 µm. Data are represented as mean ± SEM.
Figure 5
Figure 5. NF Aggregation and Neurite Degeneration in WT Neurons Expressing D90A SOD1
(A) Western blots and relative expression of SOD1 (to GPDH) in MNs and non-MNs derived from hESCs expressing D90A SOD1, WT SOD1, or EGFP. (B) Immunofluorescent images of NF-H, NF-M, and NF-Lin CHAT+ cells from SOD1-and EGFP-expressing hESCs. NF staining in the insets is magnified on the right panel. Arrows indicate NF inclusions in the cell body; arrowheads indicate NF inclusions in neurites. (C and D) Quantification of NF-inclusion-containing cell bodies (C) and neurites (D) at day 4, 7, and 10. (E) Phase contrast images of MNs and non-MNs from mutant SOD1-and EGFP-expressing hESCs. Arrows indicate bead-like formations in neurites. Inset is magnified in upper right. (F and G) p-NF-H (F) and LDH (G) in culture media from MN and non-MN cultures derived from SOD1- or EGFP-expressing hESCs. Data are represented as mean ± SEM. *p < 0.05; **p < 0.01. Scale bar = 50 µm.
Figure 6
Figure 6. Expression, Stability, and Protein Binding of NF Subunits in Neurons
(A) RT-qPCR analysis of NF-H, NF-M, and NF-L relative to GAPDH in MNs (upper panel) and non-MNs (lower panel) from ALS (D90A, A4V), genetically corrected (D90D-1 and D90D-2), and WT (IMR-90-4) iPSCs. (B) Western blots and relative (to NSE) expression of NF-H, NF-M, and NF-L in MNs and non-MNs. Representative blots are shown on the right. (C) The proportion of NF-L among total NF protein in MNs (upper panel) and non-MNs (lower panel). Data are represented as mean ± SEM. *p < 0.05 between ALS (D90A, A4V) and genetically corrected ALS (D90D) or WT (IMR-90-4) cells. (D) Relative levels of NF-L and β-actin mRNA in ALS (D90A) and corrected (D90D) MNs in the presence of actinomycin D measured by RT-qPCR. Data are represented as mean ± SEM (p < 0.05 between D90A and D90D). (E) Western blotting for mutant SOD1 in MN and non-MN samples pulled down by the 3′ UTR NF-L mRNA probe. (F) Input samples were blotted for A5C3 antibody.
Figure 7
Figure 7. Effects of NF-L Expression on NF Aggregation and Neurite Degeneration in ALS MNs
(A) Western blots and relative (to NSE) expression of NF-H, NF-M, and NF-L in MNs from GFP-, NF-L-expressing ALS (D90A) iPSCs as well as genetically corrected (D90D-1 and D90D-2) ALS iPSCs. (B) The proportion of NF-L among total NF protein in the presence of 1 µg/ml of DOX. (C and D) Quantification of NF-inclusion-containing cell bodies (C) and neurites (D) in MNs. (E) Phase contrast images of MNs at day 10. Arrows indicate bead-like swellings in neurites. Inset is magnified in upper right. (F) Immunofluorescent images of p-NF-H in MNs. Arrowheads indicate bead-like structures in neurites. (G) Quantification of bead-like formations. (H) ELISA quantification of p-NF-H in media from MN cultures. Scale bar = 50 µm. Data are represented as mean ± SEM, *p < 0.05.

Similar articles

Cited by

References

    1. Ban H, Nishishita N, Fusaki N, Tabata T, Saeki K, Shikamura M, Takada N, Inoue M, Hasegawa M, Kawamata S, Nishikawa S. Efficient generation of transgene-free human induced pluripotent stem cells (iPSCs) by temperature-sensitive Sendai virus vectors. Proc. Natl. Acad. Sci. USA. 2011;108:14234–14239. - PMC - PubMed
    1. Bergeron C, Beric-Maskarel K, Muntasser S, Weyer L, Somerville MJ, Percy ME. Neurofilament light and polyadenylated mRNA levels are decreased in amyotrophic lateral sclerosis motor neurons. J. Neuropathol. Exp. Neurol. 1994;53:221–230. - PubMed
    1. Bruijn LI, Houseweart MK, Kato S, Anderson KL, Anderson SD, Ohama E, Reaume AG, Scott RW, Cleveland DW. Aggregation and motor neuron toxicity of an ALS-linked SOD1 mutant independent from wild-type SOD1. Science. 1998;281:1851–1854. - PubMed
    1. Calvo AC, Manzano R, Atencia-Cibreiro G, Oliván S, Muñoz MJ, Zaragoza P, Cordero-Vázquez P, Esteban-Pérez J, García-Redondo A, Osta R. Genetic biomarkers for ALS disease in transgenic SOD1(G93A) mice. PLoS ONE. 2012;7:e32632. - PMC - PubMed
    1. Carpenter S. Proximal axonal enlargement in motor neuron disease. Neurology. 1968;18:841–851. - PubMed

Publication types

MeSH terms