. 2014 Apr 24;21(4):541-551.
doi: 10.1016/j.chembiol.2014.02.012. Epub 2014 Apr 3.

Large-scale identification and analysis of suppressive drug interactions

Affiliations

Large-scale identification and analysis of suppressive drug interactions

Murat Cokol et al. Chem Biol. .

Abstract

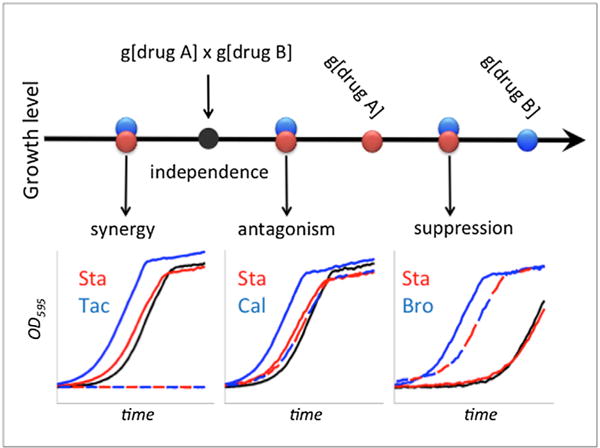
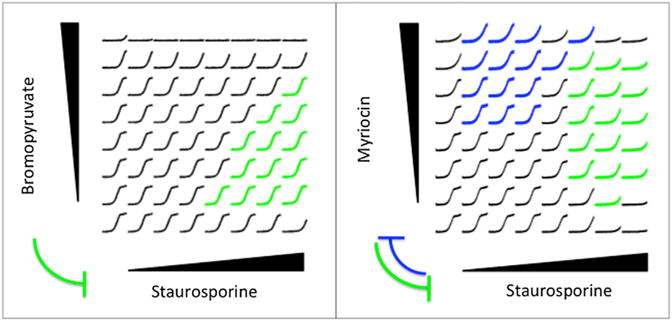
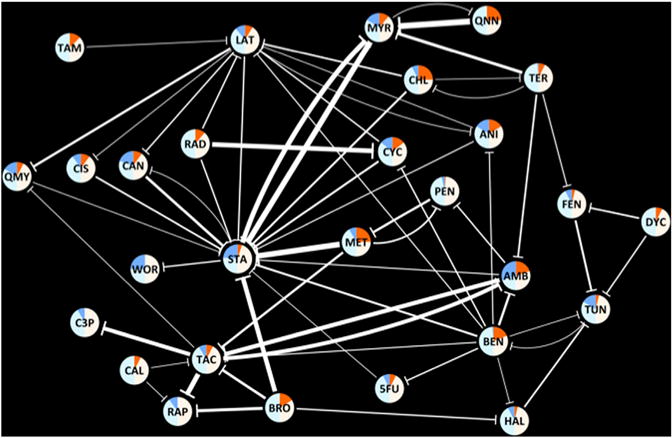
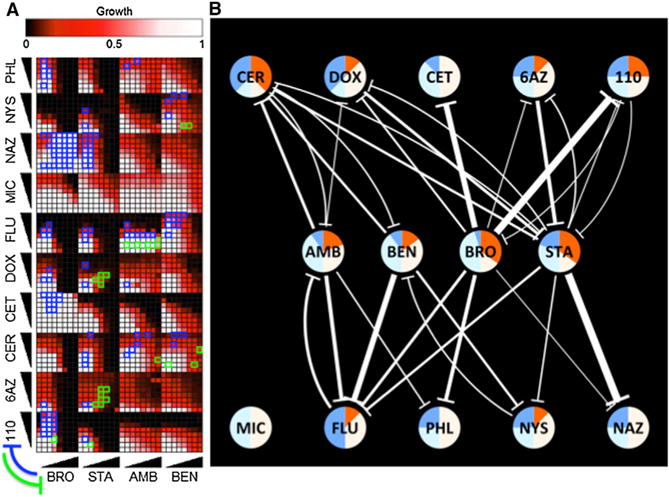
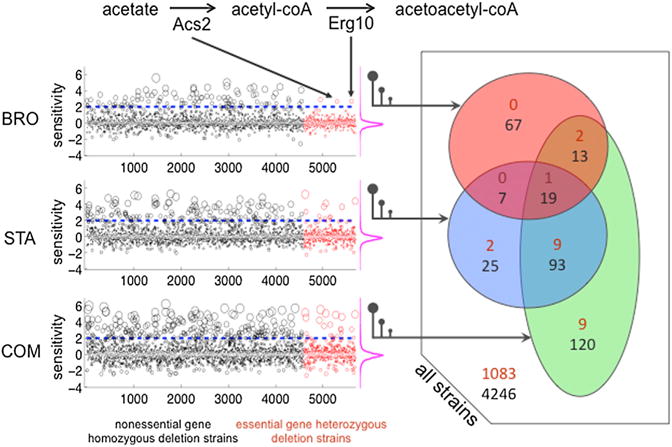
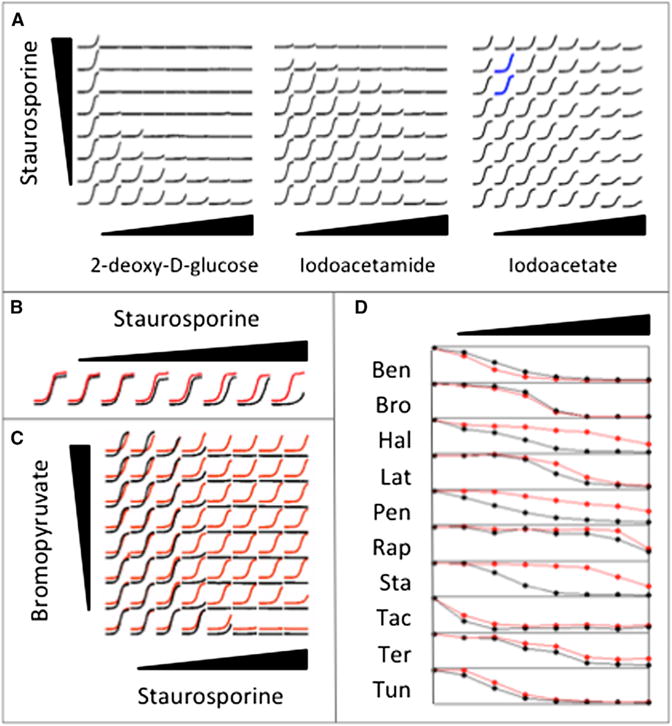
One drug may suppress the effects of another. Although knowledge of drug suppression is vital to avoid efficacy-reducing drug interactions or discover countermeasures for chemical toxins, drug-drug suppression relationships have not been systematically mapped. Here, we analyze the growth response of Saccharomyces cerevisiae to anti-fungal compound ("drug") pairs. Among 440 ordered drug pairs, we identified 94 suppressive drug interactions. Using only pairs not selected on the basis of their suppression behavior, we provide an estimate of the prevalence of suppressive interactions between anti-fungal compounds as 17%. Analysis of the drug suppression network suggested that Bromopyruvate is a frequently suppressive drug and Staurosporine is a frequently suppressed drug. We investigated potential explanations for suppressive drug interactions, including chemogenomic analysis, coaggregation, and pH effects, allowing us to explain the interaction tendencies of Bromopyruvate.


Figures

Figure 1
Figure 1. Types of Interactions between two Drugs
Certain concentrations of drug A and drug B allow growth levels g[drug A] and g[drug B], respectively. These drugs are considered independent under the Bliss independence model if their combined effect is the multiplication of the effects of individual drugs, shown as a black filled circle (g[drug A] × g[drug B]). Overlapping blue and red circles represent three possible regions under which the observed growth may fall, which correspond to three types of drug interactions. Synergy or antagonism occurs when the growth rate under drug combination is smaller or larger than independence, respectively. Suppression is an extreme form of antagonism, where the growth rate under drug combination is higher than the growth rate under [drug A]. In this case, drug B is defined to suppress drug A. Examples for each interaction type are shown as growth curves under single drugs and combinations: synergistic interaction of 0.72 μg/ml Staurosporine with 16 μg/ml Tacrolimus, antagonistic interaction of 0.72 μg/ml Staurosporine with 0.6 μg/ml Calyculin A, and suppressive interaction with 70 μg/ml Bromopyruvate suppressing 1.26 μg/ml Staurosporine. For growth curve insets: drug A, drug B, drug A+B observed, and drug A+B expected growth are depicted in red, blue, dashed blue/red, and black, respectively.
Figure 2
Figure 2. Assessing Suppression and Reciprocal Suppression
S. cerevisiae cells were grown in an 8 × 8 grid of drug combinations, where the concentration of one drug was linearly increased in each axis. The maximum dose of each drug was chosen close to its MIC. For each drug concentration combination, growth measurements (y axis) for 24 hr (x axis) are depicted. The growth curves corresponding to drug combinations in which the horizontal drug suppresses the vertical drug are given in blue, and the opposite direction of suppression are given in green. Here, we show two broadly supported suppression examples we have found among 175 drug pairs tested, where breadth is defined as the number of combinations in which the suppression phenotype was observed. Suppressive edges learned from data are shown between drug names, where the edge width represents the breadth of suppression.
Figure 3
Figure 3. A Network of 61 Suppressive Drug-Drug Interactions
Nodes represent drugs, and edges represent suppressive interactions. The width of an edge represents the breadth of suppression. The nodes are colored according to the suppression behavior of each drug. Bright blue and orange areas correspond to the frequency of “suppressed” and “suppressing” edges for a drug among all interactions against which it was tested. Similarly, light blue and white areas correspond to the frequency of “not suppressed” and “not suppressing” edges for a drug among all interactions against which it was tested. The three-letter abbreviations for each drug are given in Table 1.
Figure 4
Figure 4. Further Suppression Tests of Four Drugs against a Panel of Ten Drugs
(A) Experimental results. Drug pairs were combined in 8 × 8 matrices as described in Figure 2. Significant suppressive interactions between drugs are shown with green or blue rectangles, where suppression direction is indicated on the lower left. (B) Network representation of results of additional drug suppression tests. Nodes represent drugs, and edges represent suppressive interactions. Edge width and node coloring according to the suppression behavior of each drug are as described for Figure 3. The three-letter abbreviations for each drug are given in Table 1.
Figure 5
Figure 5. Genome-wide Sensitivity Assessment for Yeast Deletion Strains against Bromopyruvate (BroIC20), Staurosporine (StaIC20), and Their Combination (COMIC20)
In the left panel, sensitivity scores for 4,960 strains, in which both copies of a non-essential gene have been deleted, are shown as black circles (HOP). Sensitivity scores for 1,106 strains, in which one copy of an essential gene has been deleted, are shown as red circles (HIP). For visibility, the sizes of the circles are proportional to the absolute value of the sensitivity scores. In each experiment, strains are ordered by the alphabetical order of the systematic name of the deleted gene(s). On the right of each experiment, the distribution of the sensitivity scores are shown by magenta frequency distributions, indicating that a large majority of deletion strains do not show a growth change. The right panel is a Venn diagram representation of the sensitive strains. Black and red numbers correspond to homozygous or heterozygous deletion strains, respectively.
Figure 6
Figure 6. Drug Sensitivity and Interaction Assays
(A) Drug interaction assays between Staurosporine and three glycolysis inhibitors. 2-deoxy-D-glucose and Iodoacetamide do not suppress Staurosporine. The regions in which Iodoacetate suppresses Staurosporine are shown with blue growth curves. (B) Growth curves in increasing doses of Staurosporine under normal (black) and acidic (red) media are shown slightly offset for visibility in this and the next panel. For each drug concentration, growth measurements (y axis) for 24 hr (x axis) are depicted. Staurosporine has higher MIC in acidic media. (C) Drug interaction assay between Bromopyruvate and Staurosporine under buffered (black) or unbuffered (red) media. Bromopyruvate does not suppress Staurosporine under buffered media. (D) Relationship between growth level (y axis) and drug dose (x axis) for ten drugs in normal and acidic media are shown in black and red, respectively. The three-letter abbreviations for drugs are given in Table 1. Hal, Pen, and Sta have decreased toxicity, and Ben has increased toxicity under acidic conditions.

Comment in

References

    1. Abe F, Usui K, Hiraki T. Fluconazole modulates membrane rigidity, heterogeneity, and water penetration into the plasma membrane in Saccharomyces cerevisiae. Biochemistry. 2009;48:8494–8504. - PubMed
    1. Aitken A, Learmonth M. Carboxymethylation of cysteine using iodoacetamide/iodoacetic acid. In: Walker JM, editor. The Protein Protocols Handbook. Totowa, NJ: Humana Press; 1996. pp. 339–340.
    1. Bandy J, Milward D, McQuay S. Mining protein-protein interactions from published literature using Linguamatics I2E. Methods Mol Biol. 2009;563:3–13. - PubMed
    1. Berg JM, Tymoczko JL, Stryer L. Biochemistry. New York: W.H. Freeman & Company; 2010.
    1. Berriz GF, Beaver JE, Cenik C, Tasan M, Roth FP. Next generation software for functional trend analysis. Bioinformatics. 2009;25:3043–3044. - PMC - PubMed

Publication types

MeSH terms