

Plasticity and alterations of trunk motor cortex following spinal cord injury and non-stepping robot and treadmill training
- PMID: 24704619
- PMCID: PMC7222855
- DOI: 10.1016/j.expneurol.2014.03.012
Plasticity and alterations of trunk motor cortex following spinal cord injury and non-stepping robot and treadmill training
Abstract
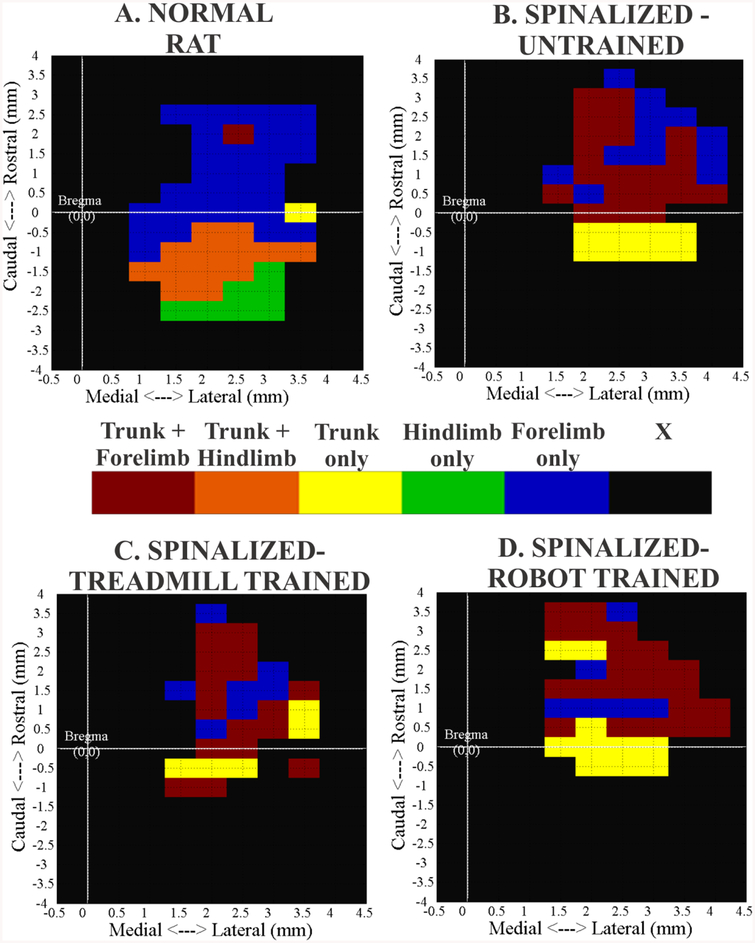
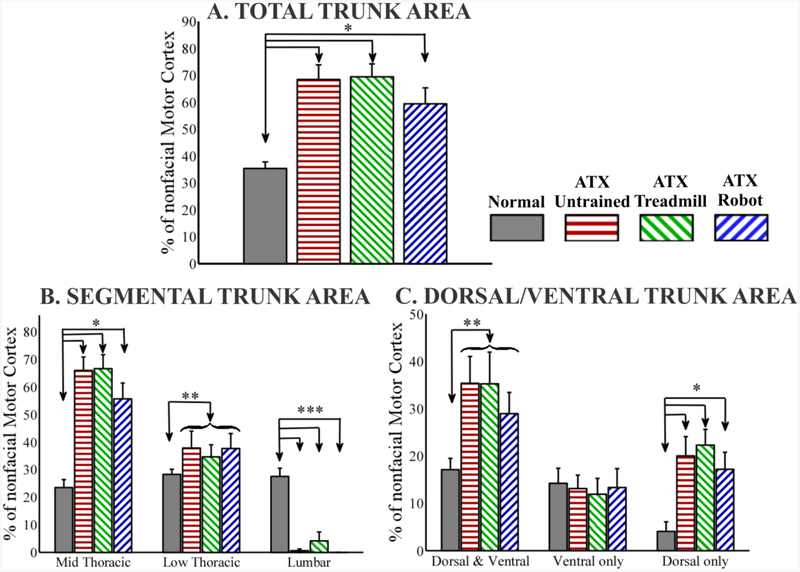
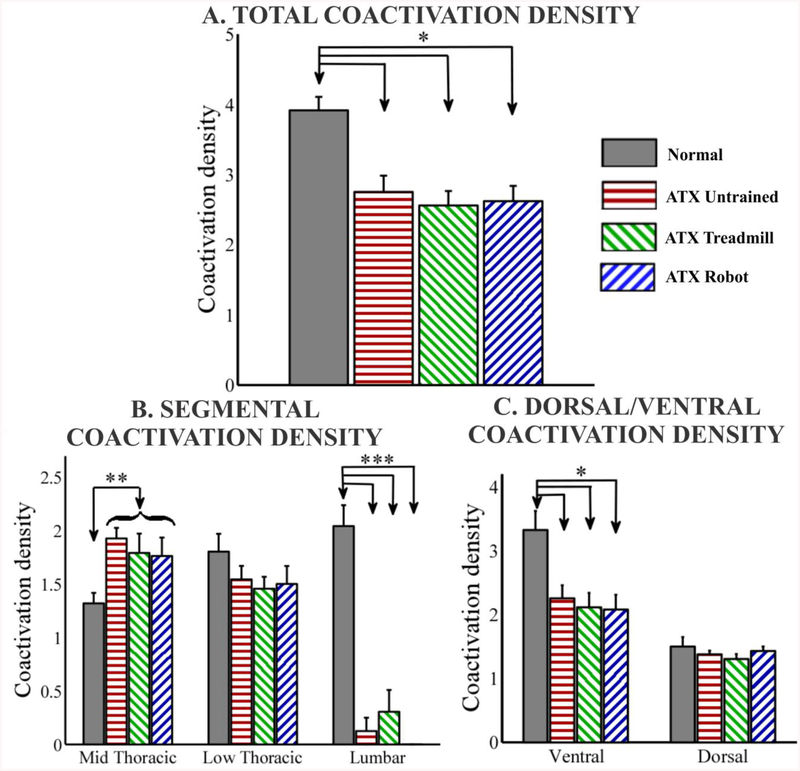
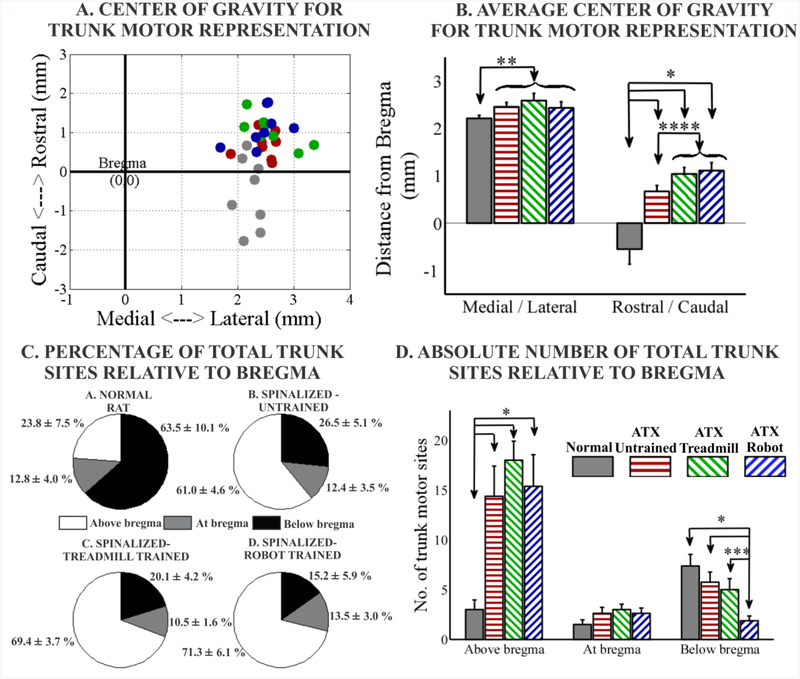
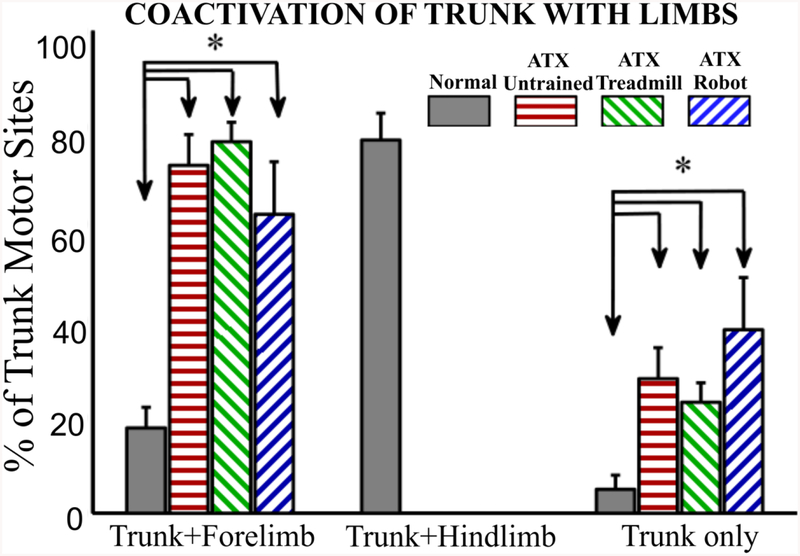
Spinal cord injury (SCI) induces significant reorganization in the sensorimotor cortex. Trunk motor control is crucial for postural stability and propulsion after low thoracic SCI and several rehabilitative strategies are aimed at trunk stability and control. However little is known about the effect of SCI and rehabilitation training on trunk motor representations and their plasticity in the cortex. Here, we used intracortical microstimulation to examine the motor cortex representations of the trunk in relation to other representations in three groups of chronic adult complete low thoracic SCI rats: chronic untrained, treadmill trained (but 'non-stepping') and robot assisted treadmill trained (but 'non-stepping') and compared with a group of normal rats. Our results demonstrate extensive and significant reorganization of the trunk motor cortex after chronic adult SCI which includes (1) expansion and rostral displacement of trunk motor representations in the cortex, with the greatest significant increase observed for rostral (to injury) trunk, and slight but significant increase of motor representation for caudal (to injury) trunk at low thoracic levels in all spinalized rats; (2) significant changes in coactivation and the synergy representation (or map overlap) between different trunk muscles and between trunk and forelimb. No significant differences were observed between the groups of transected rats for the majority of the comparisons. However, (3) the treadmill and robot-treadmill trained groups of rats showed a further small but significant rostral migration of the trunk representations, beyond the shift caused by transection alone. We conclude that SCI induces a significant reorganization of the trunk motor cortex, which is not qualitatively altered by non-stepping treadmill training or non-stepping robot assisted treadmill training, but is shifted further from normal topography by the training. This shift may potentially make subsequent rehabilitation with stepping longer or less successful.
Keywords: Activity/exercise induced plasticity; Motor cortex; Plasticity; Reorganization; Robot rehabilitation; Spinal cord injury; Trunk.
Copyright © 2014 Elsevier Inc. All rights reserved.
Figures
Similar articles
-
Trunk robot rehabilitation training with active stepping reorganizes and enriches trunk motor cortex representations in spinal transected rats.J Neurosci. 2015 May 6;35(18):7174-89. doi: 10.1523/JNEUROSCI.4366-14.2015. J Neurosci. 2015. PMID: 25948267 Free PMC article.
-
Teaching Adult Rats Spinalized as Neonates to Walk Using Trunk Robotic Rehabilitation: Elements of Success, Failure, and Dependence.J Neurosci. 2016 Aug 10;36(32):8341-55. doi: 10.1523/JNEUROSCI.2435-14.2016. J Neurosci. 2016. PMID: 27511008 Free PMC article.
-
Therapy induces widespread reorganization of motor cortex after complete spinal transection that supports motor recovery.Exp Neurol. 2016 May;279:1-12. doi: 10.1016/j.expneurol.2016.01.022. Epub 2016 Jan 28. Exp Neurol. 2016. PMID: 26826448
-
Transplants and neurotrophic factors increase regeneration and recovery of function after spinal cord injury.Prog Brain Res. 2002;137:257-73. doi: 10.1016/s0079-6123(02)37020-1. Prog Brain Res. 2002. PMID: 12440372 Review.
-
The physiological basis of neurorehabilitation--locomotor training after spinal cord injury.J Neuroeng Rehabil. 2013 Jan 21;10:5. doi: 10.1186/1743-0003-10-5. J Neuroeng Rehabil. 2013. PMID: 23336934 Free PMC article. Review.
Cited by
-
Enhancing neural activity to drive respiratory plasticity following cervical spinal cord injury.Exp Neurol. 2017 Jan;287(Pt 2):276-287. doi: 10.1016/j.expneurol.2016.08.018. Epub 2016 Aug 28. Exp Neurol. 2017. PMID: 27582085 Free PMC article. Review.
-
Cortical Reorganization of Sensorimotor Systems and the Role of Intracortical Circuits After Spinal Cord Injury.Neurotherapeutics. 2018 Jul;15(3):588-603. doi: 10.1007/s13311-018-0638-z. Neurotherapeutics. 2018. PMID: 29882081 Free PMC article. Review.
-
Ipsilesional Motor Cortex Plasticity Participates in Spontaneous Hindlimb Recovery after Lateral Hemisection of the Thoracic Spinal Cord in the Rat.J Neurosci. 2018 Nov 14;38(46):9977-9988. doi: 10.1523/JNEUROSCI.1062-18.2018. Epub 2018 Oct 9. J Neurosci. 2018. PMID: 30301755 Free PMC article.
-
Motor primitives are determined in early development and are then robustly conserved into adulthood.Proc Natl Acad Sci U S A. 2019 Jun 11;116(24):12025-12034. doi: 10.1073/pnas.1821455116. Epub 2019 May 28. Proc Natl Acad Sci U S A. 2019. PMID: 31138689 Free PMC article.
-
Differences in neuroplasticity after spinal cord injury in varying animal models and humans.Neural Regen Res. 2019 Jan;14(1):7-19. doi: 10.4103/1673-5374.243694. Neural Regen Res. 2019. PMID: 30531063 Free PMC article. Review.
References
-
- Adkins DL, Boychuk J, Remple MS,Kleim JA, 2006. Motor training induces experience-specific patterns of plasticity across motor cortex and spinal cord. J Appl Physiol 101, 1776–1782. - PubMed
-
- Anders C, Wagner H, Puta C, Grassme R, Petrovitch A,Scholle HC, 2007. Trunk muscle activation patterns during walking at different speeds. J Electromyogr Kinesiol 17, 245–252. - PubMed
-
- Antri M, Orsal D,Barthe JY, 2002. Locomotor recovery in the chronic spinal rat: effects of long-term treatment with a 5-HT2 agonist. Eur J Neurosci 16, 467–476. - PubMed
-
- Basso DM, Beattie MS,Bresnahan JC, 1995. A sensitive and reliable locomotor rating scale for open field testing in rats. J Neurotrauma 12, 1–21. - PubMed
Publication types
MeSH terms
Grants and funding
LinkOut - more resources
Full Text Sources
Other Literature Sources
Medical
