

Role of phosphodiesterase 2 in growth and invasion of human malignant melanoma cells
- PMID: 24705027
- PMCID: PMC4174556
- DOI: 10.1016/j.cellsig.2014.03.031
Role of phosphodiesterase 2 in growth and invasion of human malignant melanoma cells
Abstract
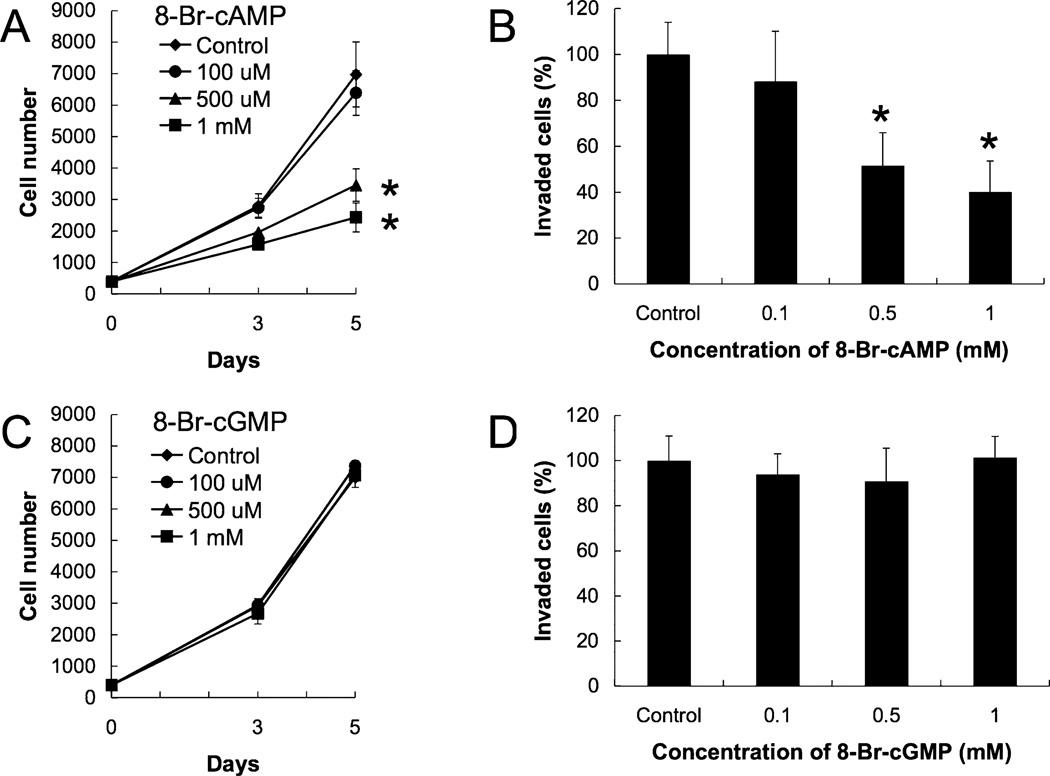
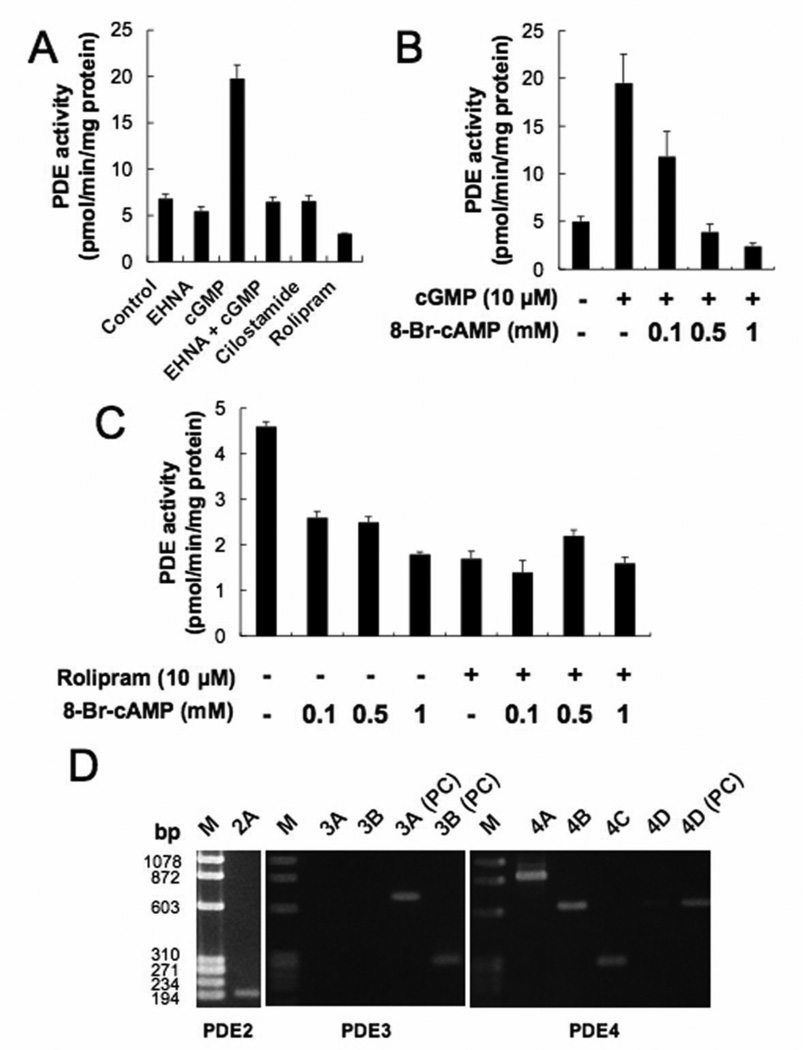
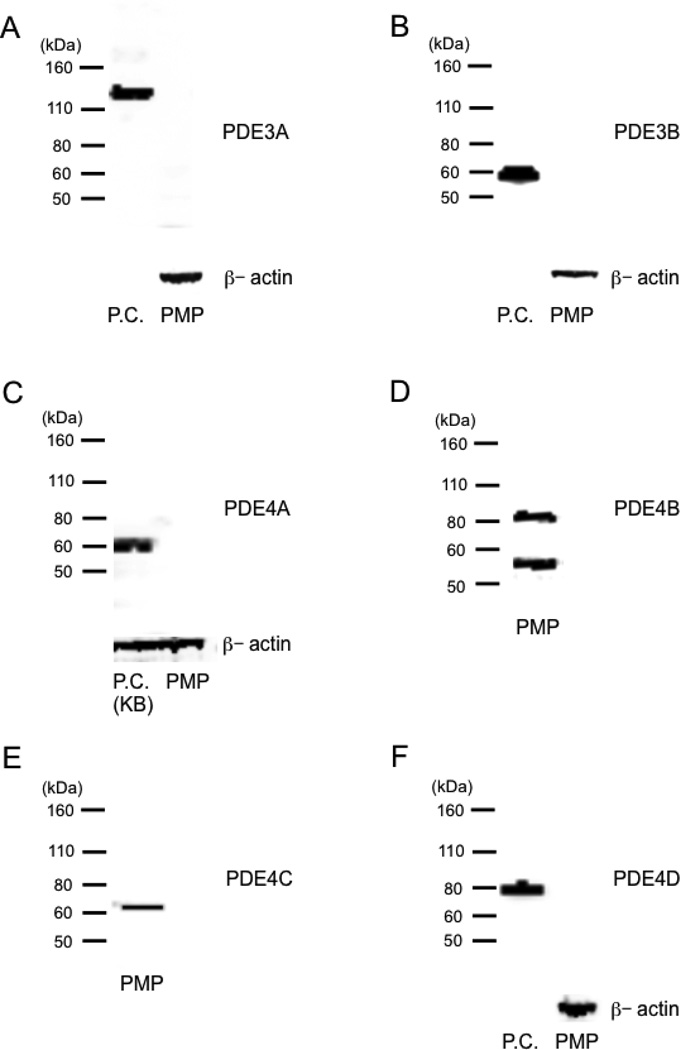
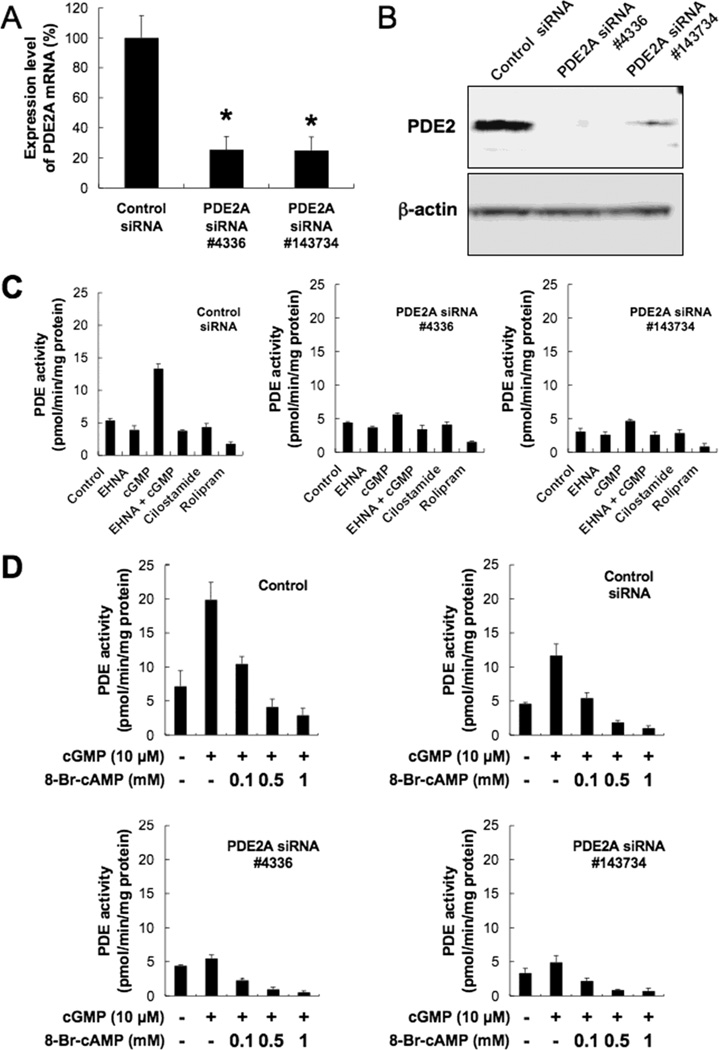
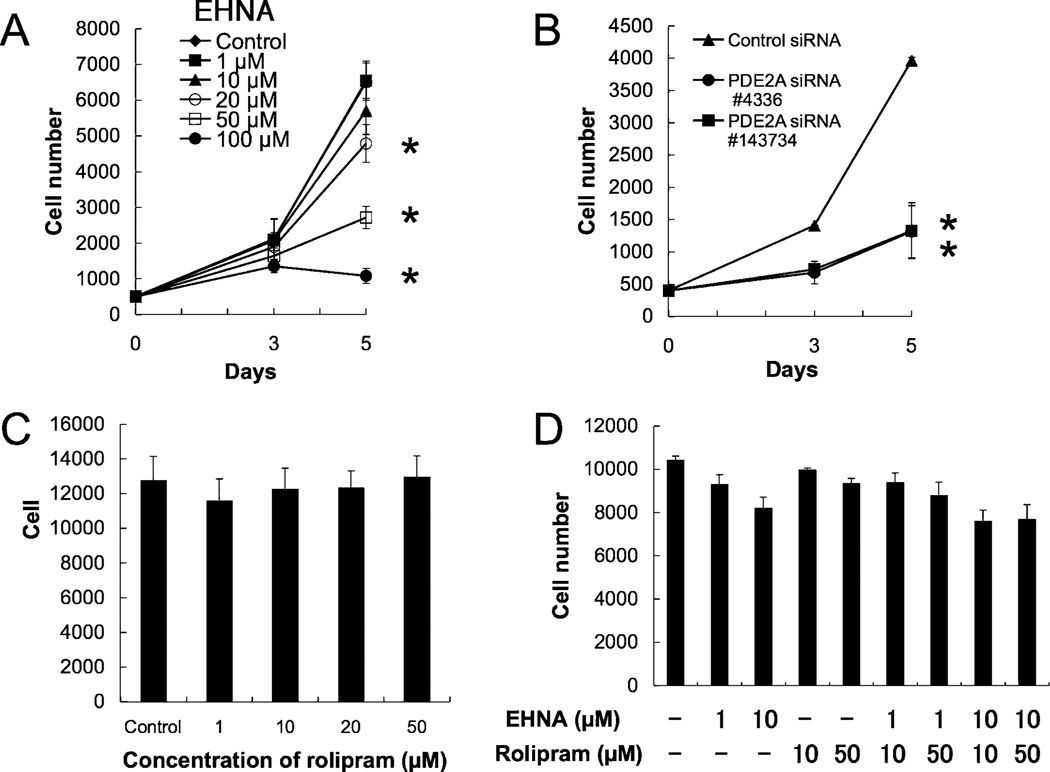
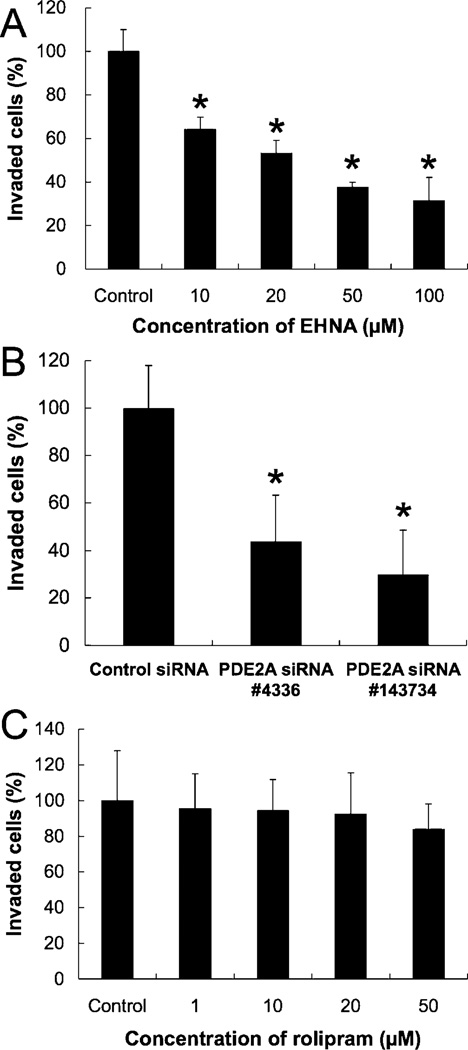
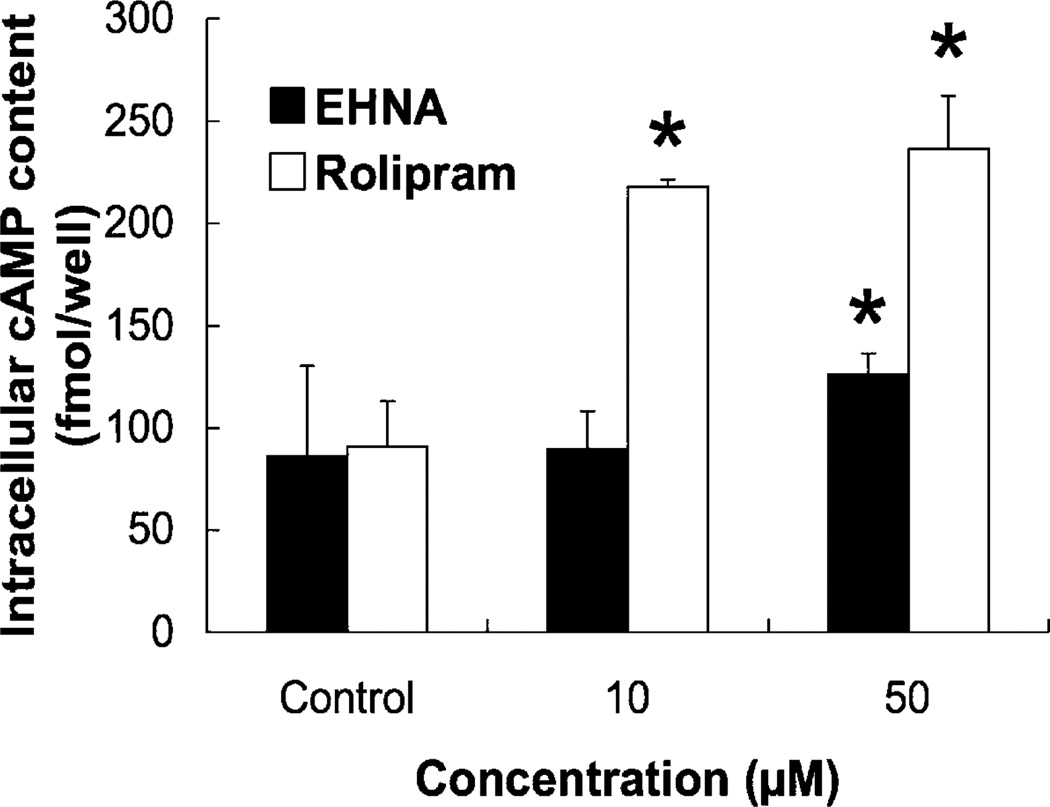
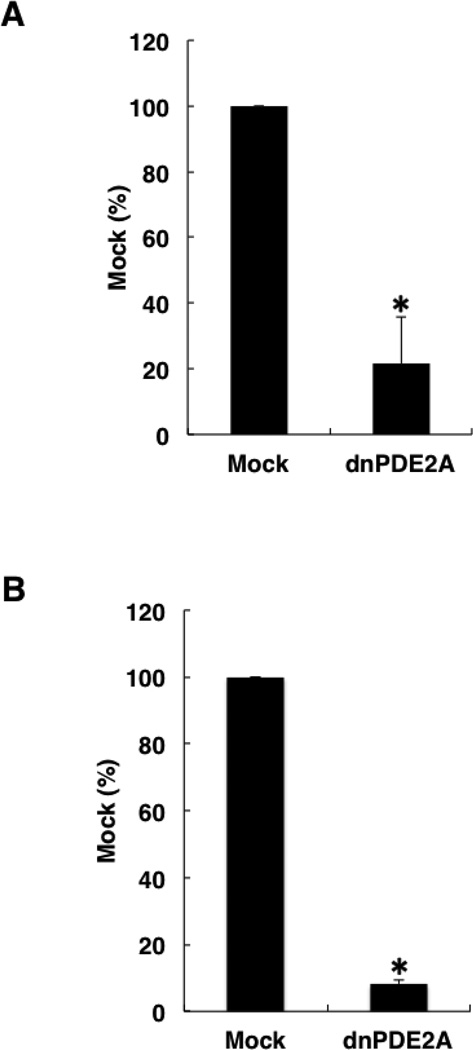
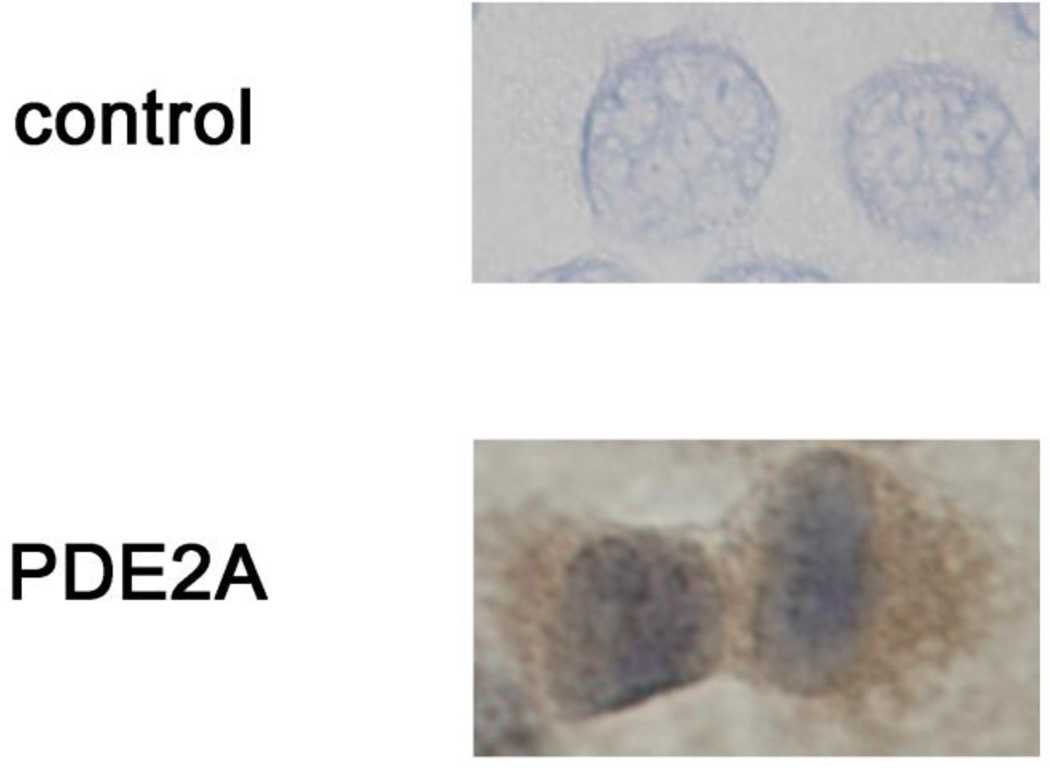
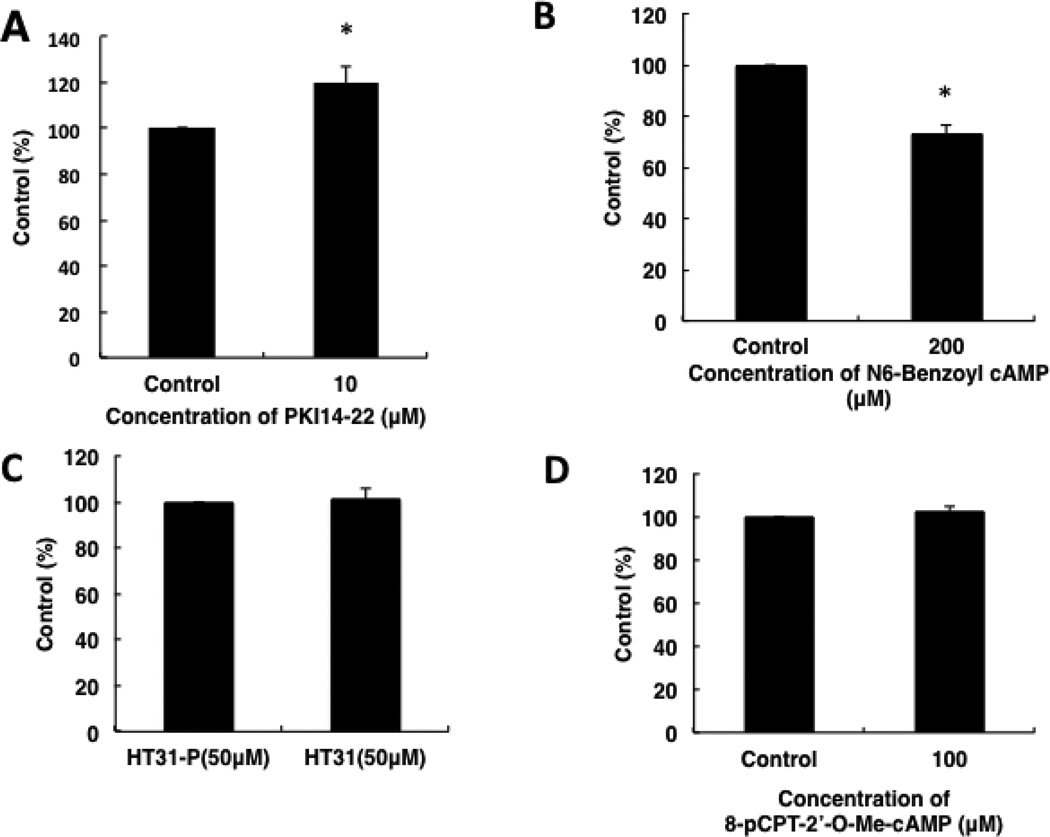
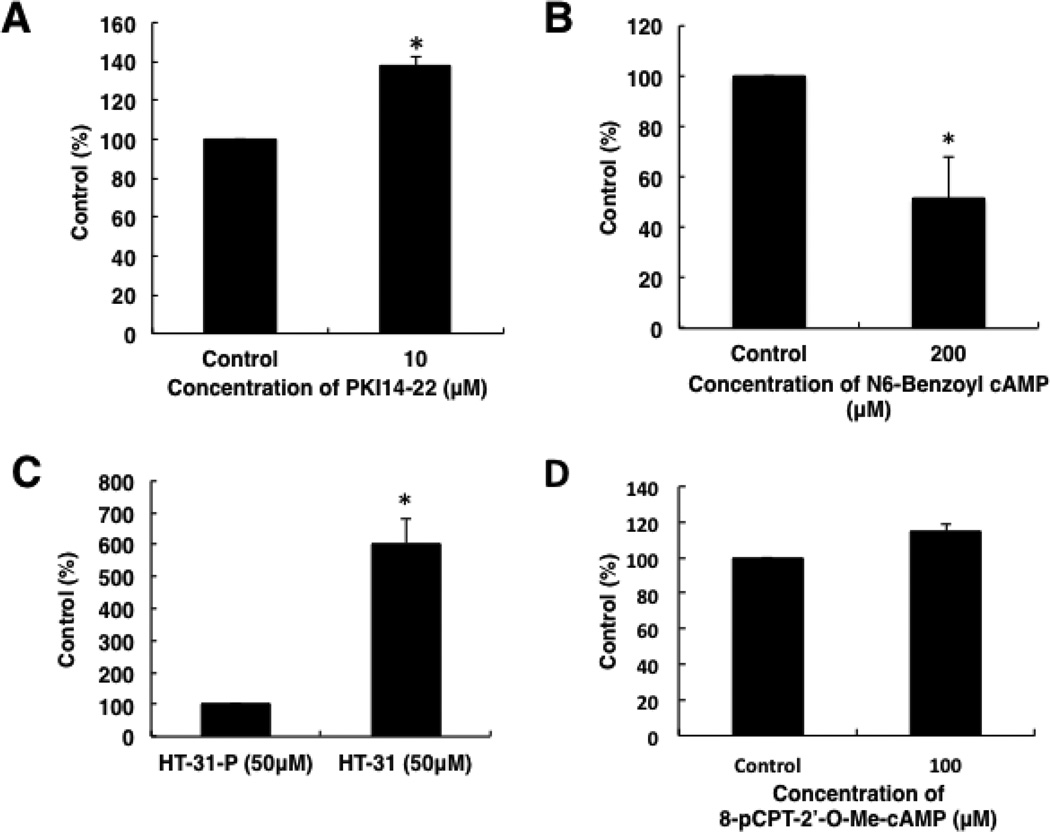
Cyclic nucleotide phosphodiesterases (PDEs) regulate the intracellular concentrations and effects of adenosine 3',5'-cyclic monophosphate (cAMP) and guanosine 3',5'-cyclic monophosphate (cGMP). The role of PDEs in malignant tumor cells is still uncertain. The role of PDEs, especially PDE2, in human malignant melanoma PMP cell line was examined in this study. In PMP cells, 8-bromo-cAMP, a cAMP analog, inhibited cell growth and invasion. However, 8-bromo-cGMP, a cGMP analog, had little or no effect. PDE2 and PDE4, but not PDE3, were expressed in PMP cells. Growth and invasion of PMP cells were inhibited by erythro-9-(2-hydroxy-3-nonyl) adenine (EHNA), a specific PDE2 inhibitor, but not by rolipram, a specific PDE4 inhibitor. Moreover, cell growth and invasion were inhibited by transfection of small interfering RNAs (siRNAs) specific for PDE2A and a catalytically-dead mutant of PDE2A. After treating cells with EHNA or rolipram, intracellular cAMP concentrations were increased. Growth and invasion were stimulated by PKA14-22, a PKA inhibitor, and inhibited by N(6)-benzoyl-c AMP, a PKA specific cAMP analog, whereas 8-(4-chlorophenylthio)-2'-O-methyl-cAMP, an Epac specific cAMP analog, did not. Invasion, but not growth, was stimulated by A-kinase anchor protein (AKAP) St-Ht31 inhibitory peptide. Based on these results, PDE2 appears to play an important role in growth and invasion of the human malignant melanoma PMP cell line. Selectively suppressing PDE2 might possibly inhibit growth and invasion of other malignant tumor cell lines.
Keywords: Cell growth; Cyclic AMP; Human malignant melanoma; Invasion; Phosphodiesterase 2.
Copyright © 2014. Published by Elsevier Inc.
Conflict of interest statement
The authors declare that they have no competing interests.
Figures
Similar articles
-
Characterization of phosphodiesterase 2A in human malignant melanoma PMP cells.Oncol Rep. 2013 Apr;29(4):1275-84. doi: 10.3892/or.2013.2260. Epub 2013 Jan 31. Oncol Rep. 2013. PMID: 23381931 Free PMC article.
-
Role of Phosphodiesterase2A in Proliferation and Migration of Human Osteosarcoma Cells.Anticancer Res. 2019 Nov;39(11):6057-6062. doi: 10.21873/anticanres.13812. Anticancer Res. 2019. PMID: 31704832
-
Rapid regulation of PDE-2 and PDE-4 cyclic AMP phosphodiesterase activity following ligation of the T cell antigen receptor on thymocytes: analysis using the selective inhibitors erythro-9-(2-hydroxy-3-nonyl)-adenine (EHNA) and rolipram.Cell Signal. 1996 Feb;8(2):97-110. doi: 10.1016/0898-6568(95)02032-2. Cell Signal. 1996. PMID: 8730511
-
Phosphodiesterase 2 and Its Isoform A as Therapeutic Targets in the Central Nervous System Disorders.CNS Neurol Disord Drug Targets. 2024;23(8):941-955. doi: 10.2174/1871527323666230811093126. CNS Neurol Disord Drug Targets. 2024. PMID: 37855295 Review.
-
The Role of Phosphodiesterase-2 in Psychiatric and Neurodegenerative Disorders.Adv Neurobiol. 2017;17:307-347. doi: 10.1007/978-3-319-58811-7_12. Adv Neurobiol. 2017. PMID: 28956338 Review.
Cited by
-
Therapeutic melanoma inhibition by local micelle-mediated cyclic nucleotide repression.Nat Commun. 2021 Oct 13;12(1):5981. doi: 10.1038/s41467-021-26269-w. Nat Commun. 2021. PMID: 34645812 Free PMC article.
-
Bioengineered 3D microvessels and complementary animal models reveal mechanisms of Trypanosoma congolense sequestration.Commun Biol. 2025 Feb 27;8(1):321. doi: 10.1038/s42003-025-07739-z. Commun Biol. 2025. PMID: 40011598 Free PMC article.
-
Migration speed of captured breast cancer subpopulations correlates with metastatic fitness.J Cell Sci. 2023 Jul 1;136(13):jcs260835. doi: 10.1242/jcs.260835. Epub 2023 Jul 4. J Cell Sci. 2023. PMID: 37313743 Free PMC article.
-
Cyclic nucleotide phosphodiesterases: important signaling modulators and therapeutic targets.Oral Dis. 2015 Jan;21(1):e25-50. doi: 10.1111/odi.12275. Epub 2014 Sep 12. Oral Dis. 2015. PMID: 25056711 Free PMC article. Review.
-
Biological roles of Yin Yang 2: Its implications in physiological and pathological events.J Cell Mol Med. 2020 Nov;24(22):12886-12899. doi: 10.1111/jcmm.15919. Epub 2020 Sep 23. J Cell Mol Med. 2020. PMID: 32969187 Free PMC article. Review.
References
-
- Manganiello VC, Degerman E. Cyclic nucleotide phosphodiesterases (PDEs): diverse regulators of cyclic nucleotide signals and inviting molecular targets for novel therapeutic agents. Thromb. Haemost. 1999;82:407–411. - PubMed
-
- Lugnier C. Cyclic nucleotide phosphodiesterase (PDE) superfamily: a new target for the development of specific therapeutic agents. Pharmacol. Ther. 2006;109:366–398. - PubMed
-
- Beavo JA, Hardman JG, Sutherland EW. Hydrolysis of cyclic guanosine and adenosine 3’,5’-monophosphates by rat and bovine tissues. J. Biol. Chem. 1970;245:5649–5655. - PubMed
-
- Martins TJ, Mumby MC, Beavo JA. Purification and characterization of a cyclic GMP-stimulated cyclic nucleotide phosphodiesterase from bovine tissues. J. Biol. Chem. 1982;257:1973–1979. - PubMed
-
- Yamamoto T, Manganiello VC, Vaughan M. Purification and characterization of cyclic GMP-stimulated cyclic nucleotide phosphodiesterase from calf liver. Effects of divalent cations on activity. J. Biol. Chem. 1983;258:12526–12533. - PubMed
Publication types
MeSH terms
Substances
Grants and funding
LinkOut - more resources
Full Text Sources
Other Literature Sources
Medical
Molecular Biology Databases
