

An integrated genetic and cytogenetic map for Zhikong scallop, Chlamys farreri, based on microsatellite markers
- PMID: 24705086
- PMCID: PMC3976258
- DOI: 10.1371/journal.pone.0092567
An integrated genetic and cytogenetic map for Zhikong scallop, Chlamys farreri, based on microsatellite markers
Erratum in
- PLoS One. 2014;9(7):e103167
Abstract
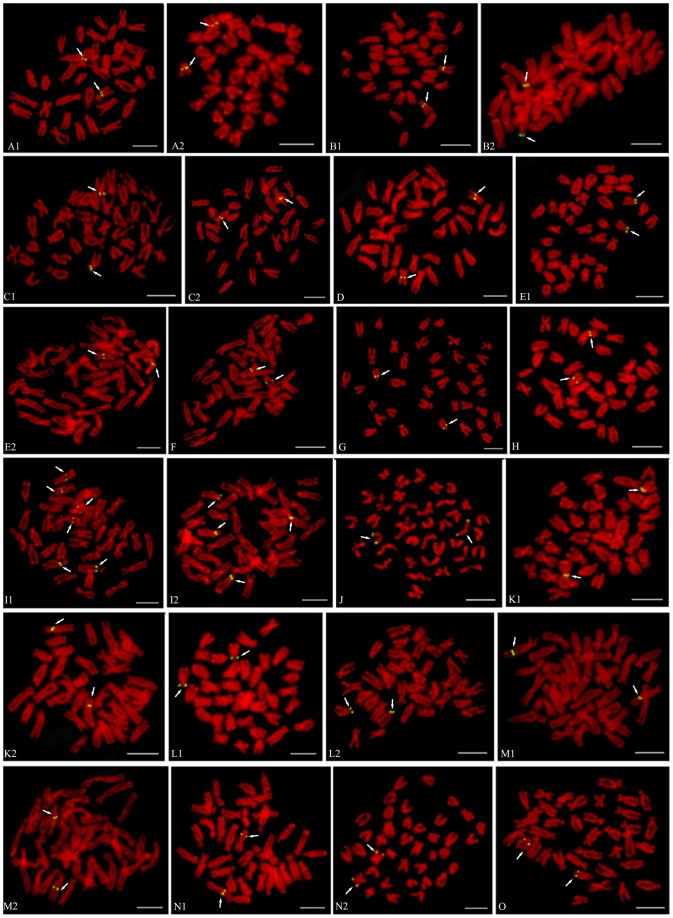
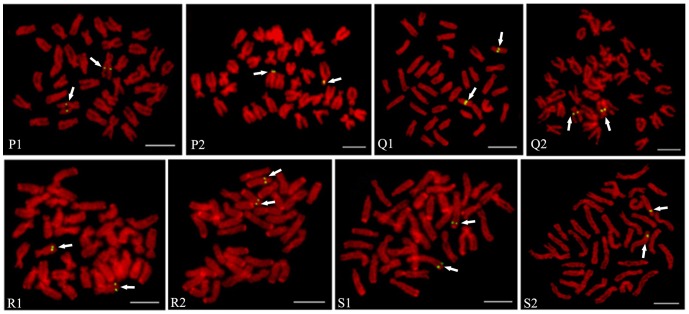
The reliability of genome analysis and proficiency of genetic manipulation requires knowledge of the correspondence between the genetic and cytogenetic maps. In the present study, we integrated cytogenetic and microsatellite-based linkage maps for Zhikong scallop, Chlamys farreri. Thirty-eight marker-anchored BAC clones standing for the 19 linkage groups were used to be FISH probes. Of 38 BAC clones, 30 were successfully located on single chromosome by FISH and used to integrate the genetic and cytogenetic map. Among the 19 linkage groups, 12 linkage groups were physically anchored by 2 markers, 6 linkage groups were anchored by 1 marker, and one linkage group was not anchored any makers by FISH. In addition, using two-color FISH, six linkage groups were distinguished by different chromosomal location; linkage groups LG6 and LG16 were placed on chromosome 10, LG8 and LG18 on chromosome 14. As a result, 18 of 19 linkage groups were localized to 17 pairs of chromosomes of C. farreri. We first integrated genetic and cytogenetic map for C. farreri. These 30 chromosome specific BAC clones in the cytogenetic map could be used to identify chromosomes of C. farreri. The integrated map will greatly facilitate molecular genetic studies that will be helpful for breeding applications in C. farreri and the upcoming genome projects of this species.
Conflict of interest statement
Figures


Similar articles
-
A Molecular Cytogenetic Map of Scallop (Patinopecten yessoensis).Mar Biotechnol (NY). 2019 Dec;21(6):731-742. doi: 10.1007/s10126-019-09918-6. Epub 2019 Aug 31. Mar Biotechnol (NY). 2019. PMID: 31473865
-
FISH mapping and identification of Zhikong scallop (Chlamys farreri) chromosomes.Mar Biotechnol (NY). 2008 Mar-Apr;10(2):151-7. doi: 10.1007/s10126-007-9045-x. Epub 2007 Oct 23. Mar Biotechnol (NY). 2008. PMID: 17955291
-
A BAC-based physical map of Zhikong scallop (Chlamys farreri Jones et Preston).PLoS One. 2011;6(11):e27612. doi: 10.1371/journal.pone.0027612. Epub 2011 Nov 16. PLoS One. 2011. PMID: 22110691 Free PMC article.
-
Consolidation of the genetic and cytogenetic maps of turbot (Scophthalmus maximus) using FISH with BAC clones.Chromosoma. 2014 Jun;123(3):281-91. doi: 10.1007/s00412-014-0452-2. Epub 2014 Jan 29. Chromosoma. 2014. PMID: 24473579
-
Use of cosmid-derived and chromosome-specific canine microsatellites.J Hered. 1999 Jan-Feb;90(1):52-4. doi: 10.1093/jhered/90.1.52. J Hered. 1999. PMID: 9987903 Review.
Cited by
-
Chromosomal mapping of tandem repeats in the Yesso Scallop, Patinopecten yessoensis (Jay, 1857), utilizing fluorescence in situ hybridization.Comp Cytogenet. 2016 Mar 21;10(1):157-69. doi: 10.3897/CompCytogen.v10i1.7391. eCollection 2016. Comp Cytogenet. 2016. PMID: 27186345 Free PMC article.
-
Scallop genome reveals molecular adaptations to semi-sessile life and neurotoxins.Nat Commun. 2017 Nov 23;8(1):1721. doi: 10.1038/s41467-017-01927-0. Nat Commun. 2017. PMID: 29167427 Free PMC article.
-
A preliminary integrated genetic map distinguishes every chromosome pair and locates essential genes related to abiotic adaptation of Crassostrea angulata/gigas.BMC Genet. 2018 Nov 15;19(1):104. doi: 10.1186/s12863-018-0689-5. BMC Genet. 2018. PMID: 30442092 Free PMC article.
-
A Molecular Cytogenetic Map of Scallop (Patinopecten yessoensis).Mar Biotechnol (NY). 2019 Dec;21(6):731-742. doi: 10.1007/s10126-019-09918-6. Epub 2019 Aug 31. Mar Biotechnol (NY). 2019. PMID: 31473865
-
Comparative Transcriptome Analysis of the Pacific Oyster Crassostrea gigas Characterized by Shell Colors: Identification of Genetic Bases Potentially Involved in Pigmentation.PLoS One. 2015 Dec 22;10(12):e0145257. doi: 10.1371/journal.pone.0145257. eCollection 2015. PLoS One. 2015. PMID: 26693729 Free PMC article.
References
-
- Waller TR (1991) Evolutionary relationships among commercial scallops (Mollusca: Bivalvia: Pectinidae). Scallops: Biology, Ecology and Aquaculture. 1–73
-
- Guo XM, Ford SE, Zhang FS (1999) Molluscan aquaculture in China. Journal of Shellfish Research 18 (1) 19–31.
-
- Bureau of Fisheries. 2012 China Fishery Statistical Yearbook. Beijing.
-
- Li Z, Bao ZM, Pan J, Wan JF, Hu XL, et al. (2002) RAPD analysis of three Farrer's scallop (Chlamys farreri) populations. Journal of Ocean University of Qingdao 32 (Sup.) 179–183.
-
- Zhao Y, Bao ZM, Pan J, Bi K, Hu XL, et al. (2002) Effects of artificial selection on genetic diversity in the populations of scallop (Chlamys farreri). Journal of Ocean University of Qingdao 32 (Sup.) 41–44.
Publication types
MeSH terms
LinkOut - more resources
Full Text Sources
Other Literature Sources
Research Materials
