. 2013 Mar 4;4(1):46-64.
doi: 10.3390/genes4010046.

Differential Effects of MicroRNAs on Glioblastoma Growth and Migration

Affiliations

Differential Effects of MicroRNAs on Glioblastoma Growth and Migration

Duane Jeansonne et al. Genes (Basel). .

Abstract

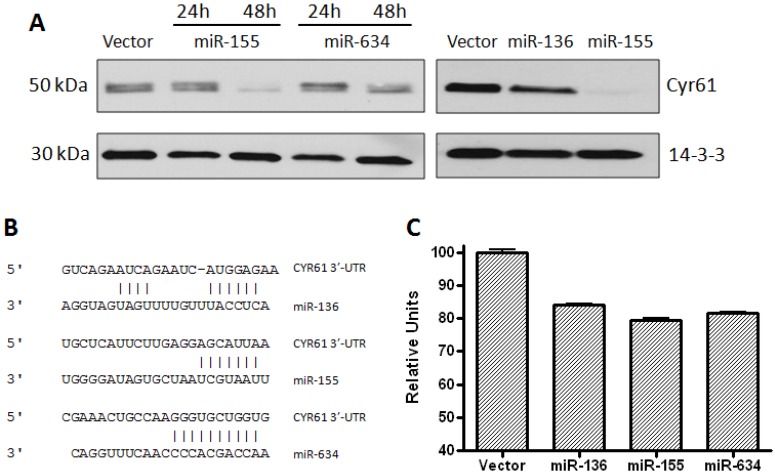
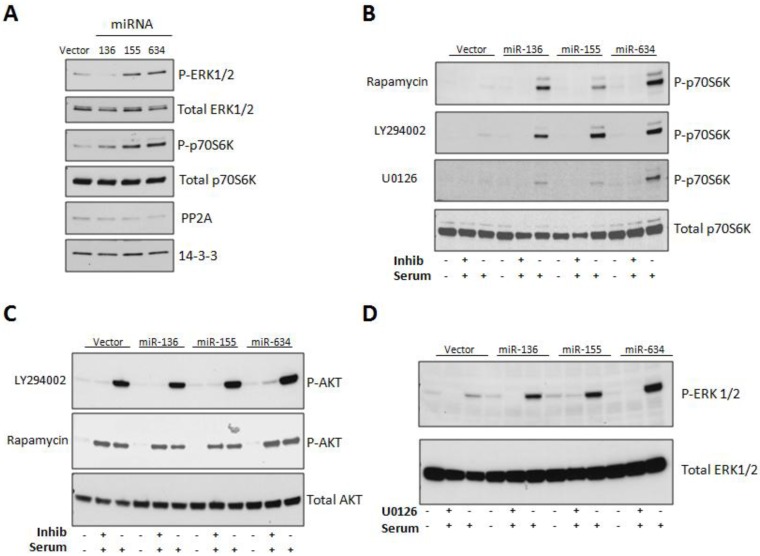
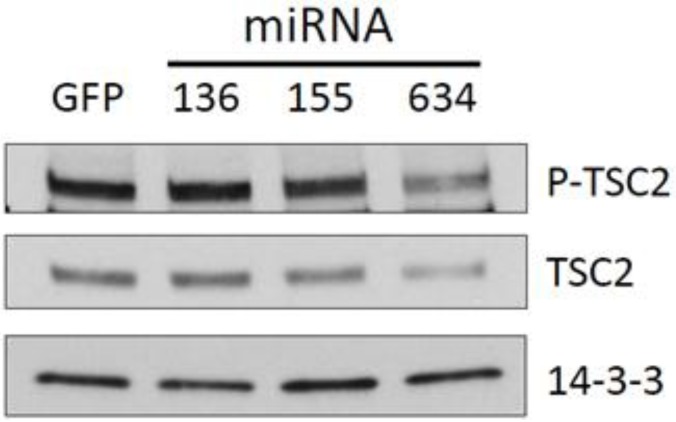
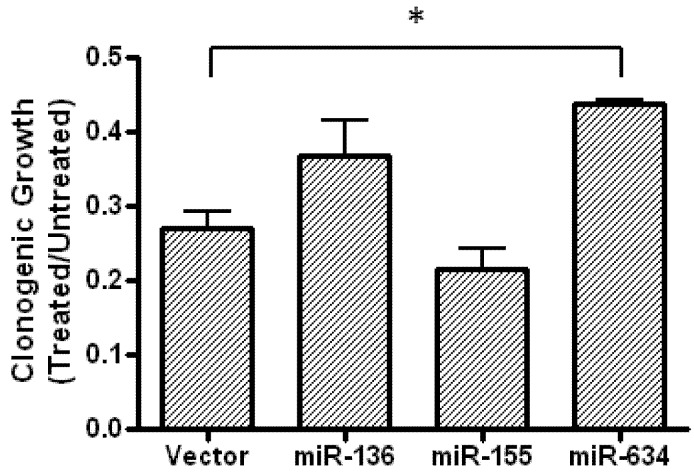
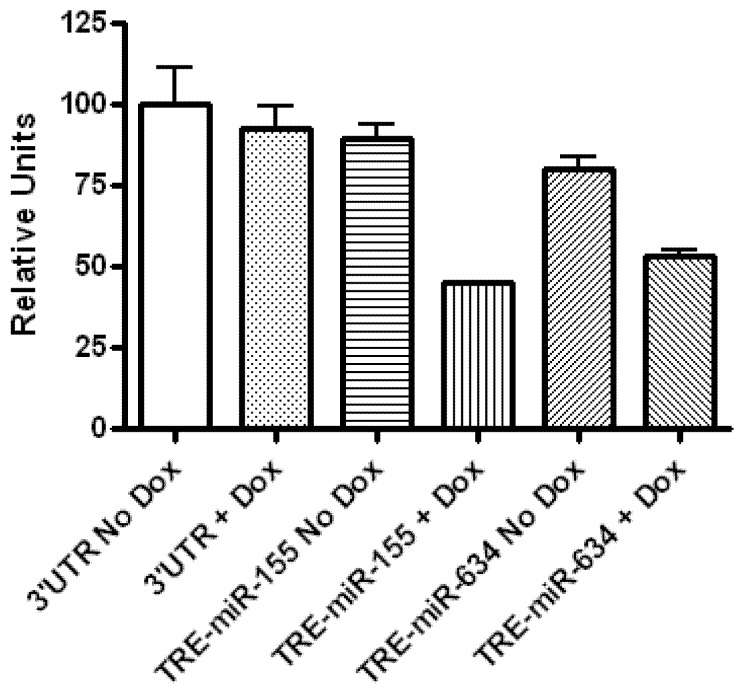
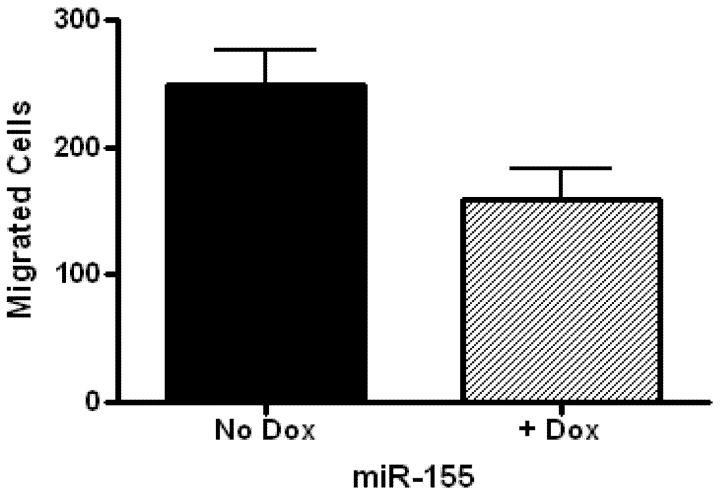
Glioblastoma multiforme is characterized by rapid proliferation, aggressive metastatic potential, and resistance to radio- and chemotherapy. The matricellular protein CYR61 regulates cellular proliferation and migration and is highly expressed in Glioblastomas. MicroRNAs are 22-nucleotides long RNAs that regulate gene expression post-transcriptionally. Here, we utilized the LN229 glioblastoma cell line and found that CYR61 is a target of miR-136, miR-155, and miR-634. Over-expression of miR-136 and miR-634 miRNAs negatively affected proliferation, but not migration, while expression of miR-155 reduced migration but did not affect the proliferation of LN229 cells. Investigation of the molecular mechanisms affected by expression of miR-634 revealed an increased phosphorylation of p70S6 kinase, suggesting an induction of the mammalian target of rapamycin (mTOR) complex 1 pathway. Additionally, in miR-634 overexpressing cells, TSC2, a negative regulator of mTOR signaling, was found to be decreased. Altogether, our study provides insights on the differential roles of miRs-136, -155, and -634 in regulating glioblastoma cell growth and migration, and how microRNAs could be manipulated to decrease the aggressiveness and metastatic potential of tumor cells.


Figures

Figure 1
Figure 1
CYR61 is a target for miR-136, miR-155, and miR-634. (A) Western blot showing levels of CYR61 in LN229 cells transfected with miRNA-expressing Block-iT plasmids. 14-3-3 antibody was used to show equal loading of cellular lysates. (B) Diagram depicting the predicted binding sites of the microRNAs to the 3’UTR of cyr61 mRNA sequence. (C) Luciferase assays of HeLa cells co-nucleofected with cyr61 3’UTR and miRNA-expressing plasmids. Firefly and Renilla values were determined at 24 h post-nucleofection of cells. The data represents the ratio between Renilla values and firefly internal control for each group. Assays were performed in duplicate.
Figure 2
Figure 2
Differential effects of miR-136, miR-155, and miR-634 on cell growth and migration of LN229 cells. (A) Plot showing the growth of miRNA-expressing LN229 cells at 24 h, 48 h, and 72 h after plating. Experiment was repeated twice, each in duplicate. (B) Migration assay of miRNA-expressing LN229 cells. At 48 h post-transfection, GFP+ cells were sorted onto 8 µm filter membranes and allowed to migrate for 16h (see Experimental Section). Experiment was repeated twice, each in triplicate. (C) Migration assay in the presence of recombinant CYR61. LN229 cells were nucleofected with plasmid expressing miR-155 or empty vector and plated onto membranes with or without the presence of 200 ng/mL CYR61. Migration assays were performed as described above. * indicates values that are statistically significantly different (p ≤ 0.05).
Figure 3
Figure 3
Expression of microRNAs (-136, -155, or -634) up-regulate mTOR signaling in an AKT- and ERK1/2-dependent manner. (A) Western blot analysis of cells nucleofected with miRNA-expressing plasmids. Western blot of phospho- and total proteins was performed on lysates from LN229 cells that were transiently nucleofected with empty or miRNA-expressing plasmids for 48 h. (B) Western blot of phospho-p70SK (T389) and total p70SK. Western blot was performed on lysates from LN229 cells that stably express empty or miRNA-expressing plasmids and were pretreated with specific inhibitors (50 µM LY294002, 10 nM Rapamycin, or 15 µM U0126) for 1 h followed by stimulation with 10% serum for 1 h. (C) Western blot of phospho- and total AKT (S473). Cells were treated as described in panel B. (D) Western blot of phospho- and total ERK1/2 (T202/Y204). Cells were treated as described in panel B.
Figure 4
Figure 4
miR-634 reduces the expression of TSC2, a negative regulator of mTOR signaling. Western blot of phospho- and total TSC2. Western blot analysis was performed on lysates from cells that were nucleofected with empty or miRNA-expressing plasmids for 48 h. 14-3-3 antibody was used to show equal loading of cellular lysates.
Figure 5
Figure 5
(A) List of fenofibrate regulated mRNAs in LN229 cells. Fold change values reflect mRNA levels in cells treated with 50 µM fenofibrate versus untreated cells. Results shown are the average of two independent experiments. (B) Down-regulation of CYR61 protein expression in LN229 glioblastoma cells after fenofibrate treatment. Western blot of CYR61 was performed on lysates from cells that were untreated or treated with fenofibrate (50 µM) for 24 h or 48 h. GRB2 antibody was used to show equal loading of cellular lysates.
Figure 6
Figure 6
LN229 cells expressing miR-634 are less sensitive to the growth suppressive effects of fenofibrate. Clonogenic assay of LN229 cells stably expressing the indicated microRNAs. Experiment was repeated twice, each in duplicate. * indicates values that are statistically significantly different (p ≤ 0.05).
Figure S1
Figure S1
Inhibitory effect of induced miR-155 and miR-634 expression on cyr61. Luciferase assay of LN229 cells transiently co-transfected with the cyr61 3’UTR and empty vector or with TRE3G-IRES-miRNA expressing plasmids. miRNA-expressing plasmids were under the control of a doxycycline-inducible vector. Firefly and Renilla. values were determined at 24 h post-transfection. The data represent the ratio between Renilla. values and firefly internal control for each group (n = 2).
Figure S2
Figure S2
Migration assay of LN229 cells expressing miR-155 under the control of a doxycycline-inducible vector. Expression of miR-155 was induced for 48 h before plating onto 8 µm membranes, as detailed in Experimental Section.

References

    1. Nagasawa D.T., Chow F., Yew A., Kim W., Cremer N., Yang I. Temozolomide and other potential agents for the treatment of glioblastoma multiforme. Neurosurg. Clin. N Am. 2012;23:307–322, ix. - PubMed
    1. Cavenee W.K. Accumulation of genetic defects during astrocytoma progression. Cancer. 1992;70:1788–1793. doi: 10.1002/1097-0142(19920915)70:4+<1788::AID-CNCR2820701621>3.0.CO;2-L. - DOI - PubMed
    1. Drukala J., Urbanska K., Wilk A., Grabacka M., Wybieralska E., Del Valle L., Madeja Z., Reiss K. ROS accumulation and IGF-IR inhibition contribute to fenofibrate/PPARalpha—mediated inhibition of glioma cell motility in vitro. Mol. Cancer. 2010;9:159. doi: 10.1186/1476-4598-9-159. - DOI - PMC - PubMed
    1. Furnari F.B., Huang H.J., Cavenee W.K. Genetics and malignant progression of human brain tumours. Cancer Surv. 1995;25:233–275. - PubMed
    1. Haas-Kogan D., Shalev N., Wong M., Mills G., Yount G., Stokoe D. Protein kinase B (PKB/Akt) activity is elevated in glioblastoma cells due to mutation of the tumor suppressor PTEN/MMAC. Curr. Biol. 1998;8:1195–1198. doi: 10.1016/S0960-9822(07)00493-9. - DOI - PubMed