. 2013 Jun 4;4(2):275-92.
doi: 10.3390/genes4020275.

Altered Ca2+ homeostasis and endoplasmic reticulum stress in myotonic dystrophy type 1 muscle cells

Affiliations

Altered Ca2+ homeostasis and endoplasmic reticulum stress in myotonic dystrophy type 1 muscle cells

Annalisa Botta et al. Genes (Basel). .

Abstract

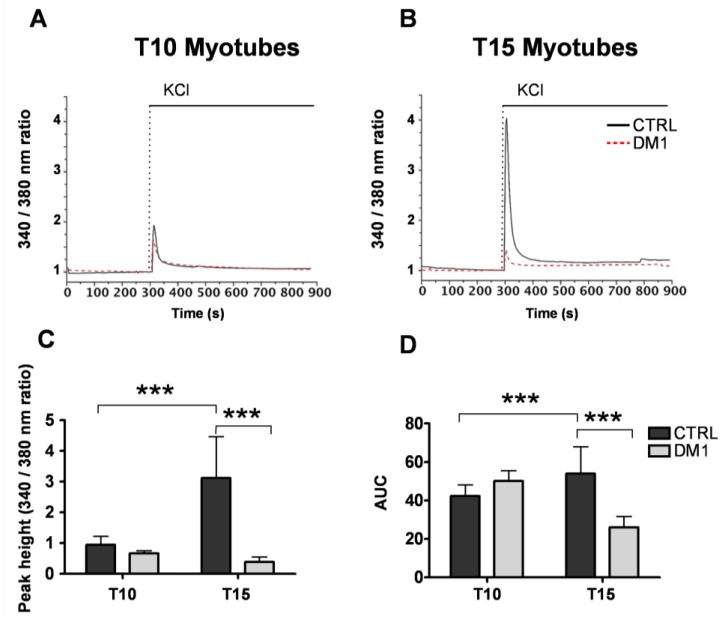
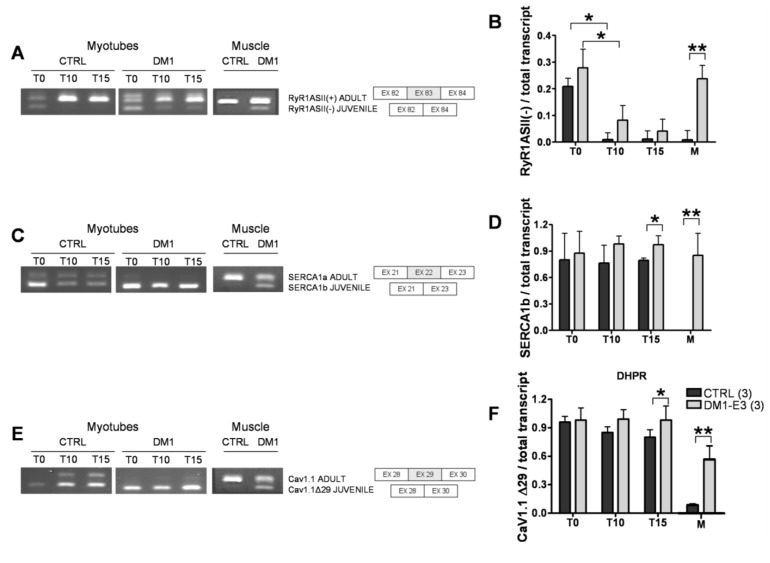
The pathogenesis of Myotonic Dystrophy type 1 (DM1) is linked to unstable CTG repeats in the DMPK gene which induce the mis-splicing to fetal/neonatal isoforms of many transcripts, including those involved in cellular Ca2+ homeostasis. Here we monitored the splicing of three genes encoding for Ca2+ transporters and channels (RyR1, SERCA1 and CACN1S) during maturation of primary DM1 muscle cells in parallel with the functionality of the Excitation-Contraction (EC) coupling machinery. At 15 days of differentiation, fetal isoforms of SERCA1 and CACN1S mRNA were significantly higher in DM1 myotubes compared to controls. Parallel functional studies showed that the cytosolic Ca2+ response to depolarization in DM1 myotubes did not increase during the progression of differentiation, in contrast to control myotubes. While we observed no differences in the size of intracellular Ca2+ stores, DM1 myotubes showed significantly reduced RyR1 protein levels, uncoupling between the segregated ER/SR Ca2+ store and the voltage-induced Ca2+ release machinery, parallel with induction of endoplasmic reticulum (ER) stress markers. In conclusion, our data suggest that perturbed Ca2+ homeostasis, via activation of ER stress, contributes to muscle degeneration in DM1 muscle cells likely representing a premature senescence phenotype.


Figures

Figure 1
Figure 1
Depolarization induced cytosolic Ca2+ responses in control and Myotonic Dystrophy type 1 (DM1) myotubes at sequential stages of differentiation. Depolarization was induced by the addition of 120 mM KCl to the myotubes at 10 days (T10, A) and 15 days (T15, B) of differentiation. [Ca2+] was assessed by measuring fura-2 ratios at 340 nm and 380 nm excitation as described in the Methods section. Representative traces of n > 6 experiments are shown. (C) Quantification of the Ca2+ peak responses induced by KCl in control and DM1 myotubes. (D) Quantification of the area under the curves (AUC). Data represent mean ± SD. *** p < 0.001 as compared to controls by Students’ t test.
Figure 2
Figure 2
Size of the ER/SR Ca2+ stores in control and DM1 myotubes at progressive stages of differentiation. Depletion of ER/SR Ca2+ stores in myotubes at 10 (T10, A) and 15 days (T15, B) of differentiation was induced by the SERCA inhibitor tert-butylhydroquinone (tBHQ) at indicated time points. [Ca2+] was assessed by measuring Fura-2 ratios at 340 nm and 380 nm excitation as described in the Methods section. Representative traces of n > 8 experiments are shown. (C) Quantification of the Ca2+ peaks induced by tBHQ in control and DM1 myotubes. (D) Quantification of the area under the curves (AUC). Data represent mean ± SD. *** p < 0.001 as compared to controls by Students’ t test.
Figure 3
Figure 3
Splicing patterns of Ca2+ channels and transporters in control and DM1 myotubes at 10 (T10) and 15 (T15) days of differentiation. (A) RyR1 alternative splicing of fetal ASII(−) and ASII(+) isoforms and schematic representation of the ASII splicing isoforms of RyR1. (B) Quantification of RyR ASII(−) as compared to the total transcript. (C) SERCA1 alternative splicing of fetal SERCA1b and adult SERCA1a isoforms and schematic representation of the SERCA1 splicing isoforms. (D) Quantification of fetal SERCA1b as compared to the total transcript. (E) Cav1.1 alternative splicing of fetal Cav1.1Δ29 and adult Cav1.1 isoforms and schematic representation of the Cav1.1 splicing isoforms. (F) Quantification of fetal Cav1.1 Δ29 as compared to the total transcript. PCR products were separated in 3% agarose gel by electrophoresis. Data are the mean ± SD. * p < 0.05, ** p < 0.01 as compared to controls by Students’ t test. The numbers of single lines studied is given in brackets.
Figure 4
Figure 4
Expression of Ca2+ channels and transporters in control and DM1 myotubes at 10 (T10) and 15 (T15) days of differentiation. (A) Representative images of SERCA2 (green) and RyR1 (red), nuclei (blue-Dapi) immunofluorescence of T15 differentiated control and DM1 myotubes. Scale bar is 10 μm. (B) Representative Western blot analysis of RyR1, DHPR α1s (Cav1.1) and SERCA2 of control and DM1 myotubes at 10 and 15 days of differentiation. (CE) Quantification of RyR1, DHPRα1s and SERCA2 protein levels normalized to β-actin. Data are the mean ± SD of two experiments. ** p < 0.01 as compared to controls by Students’ t test. The numbers of single lines studied is given in brackets.
Figure 5
Figure 5
Characterization of the ER stress response in control and DM1 myotubes at 10 (T10) and 15 (T15) days of differentiation. (A) Expression levels of CHOP and GRP78 mRNA of control and DM1 myotubes at 10 and 15 days of differentiation as measured by quantitative RT-PCR. (B) Representative Western blot of CHOP and GRP78 from control and DM1 myotubes at 10 and 15 days of differentiation. (C) Quantification of CHOP and GRP78 protein levels, normalized to β-actin. The values represent the ratio of band intensities and are given in arbitrary units (A.U.) Data are expressed as mean ± SD of a single experiment of RT-PCR carried out in triplicate (A) and as mean ± ES of two experiments for WB (C). * p < 0.05, *** p < 0.001 as compared to controls by Students’ t test.
Figure 6
Figure 6
Expression of SR/ER resident proteins in control and DM1 myotubes at 10 (T10) and 15 (T15) days of differentiation. (A) Representative Western blot analysis of calnexin, calsequestrin and MG29 in control and DM1 myotubes at 10 and 15 days of differentiation. (B) Quantification of MG29 protein levels, normalized to β-actin. The values are given in arbitrary units (A.U.) and expressed as mean ± SD of two experiments. * p < 0.05 as compared to controls by Students’ t test. The numbers of single lines studied is given in brackets.

References

    1. Harper P.S. Myotonic Dystrophy. W.B. Saunders Company; London, UK: 2001.
    1. Wagner A., Steinberg H. Hans Steinert (1875–1911) J. Neurol. 2008;255:1607–1608. doi: 10.1007/s00415-008-0004-x. - DOI - PubMed
    1. Machuca-Tzili L., Brook D., Hilton-Jones D. Clinical and molecular aspects of the myotonic dystrophies: A review. Muscle Nerve. 2005;32:1–18. doi: 10.1002/mus.20301. - DOI - PubMed
    1. Wheeler T.M., Thornton C.A. Myotonic dystrophy: RNA-Mediated muscle disease. Curr. Opin. Neurol. 2007;20:572–576. doi: 10.1097/WCO.0b013e3282ef6064. - DOI - PubMed
    1. Cooper T.A. Chemical reversal of the RNA gain of function in myotonic dystrophy. Proc. Natl. Acad. Sci. USA. 2009;106:18433–18434. doi: 10.1073/pnas.0910643106. - DOI - PMC - PubMed

LinkOut - more resources