. 2014 May;15(5):465-72.
doi: 10.1038/ni.2866. Epub 2014 Apr 6.

Protein kinase C-η controls CTLA-4-mediated regulatory T cell function

Affiliations

Protein kinase C-η controls CTLA-4-mediated regulatory T cell function

Kok-Fai Kong et al. Nat Immunol. 2014 May.

Abstract

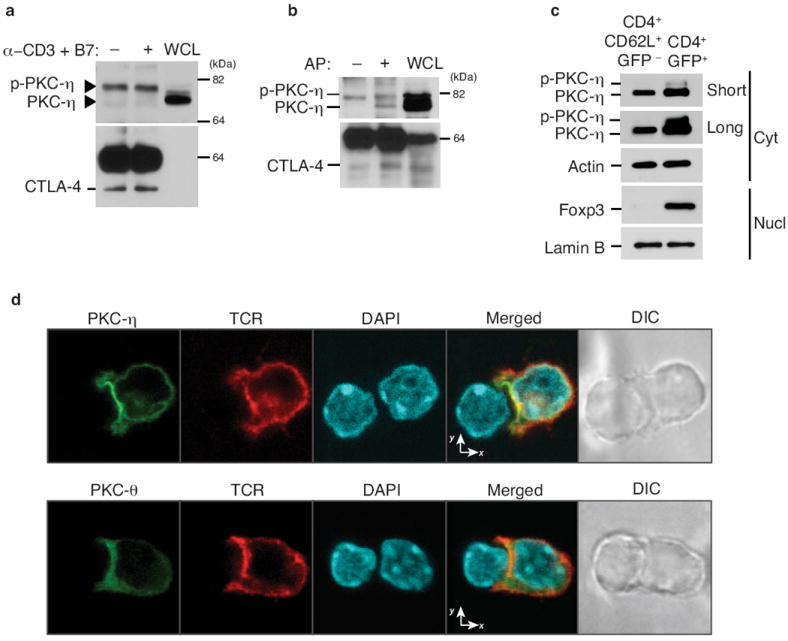
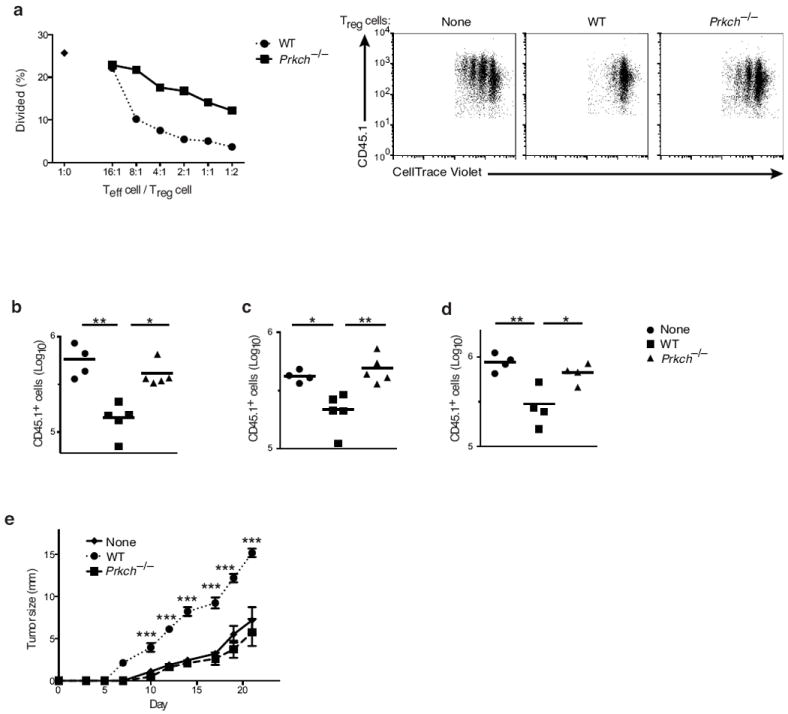
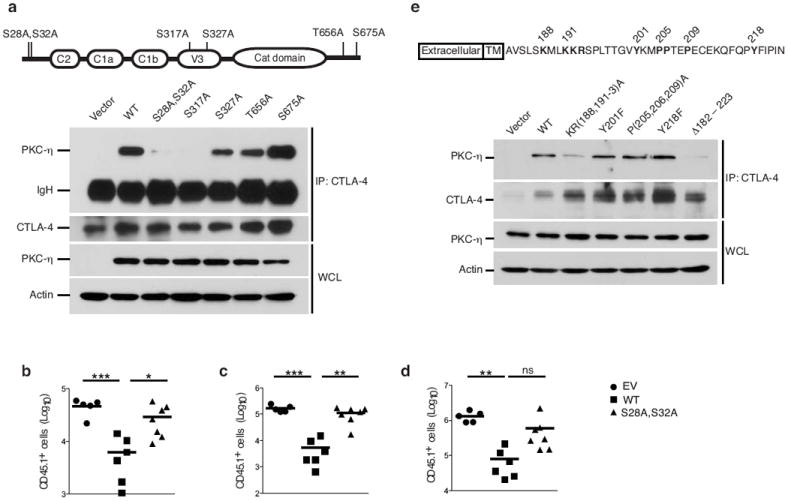
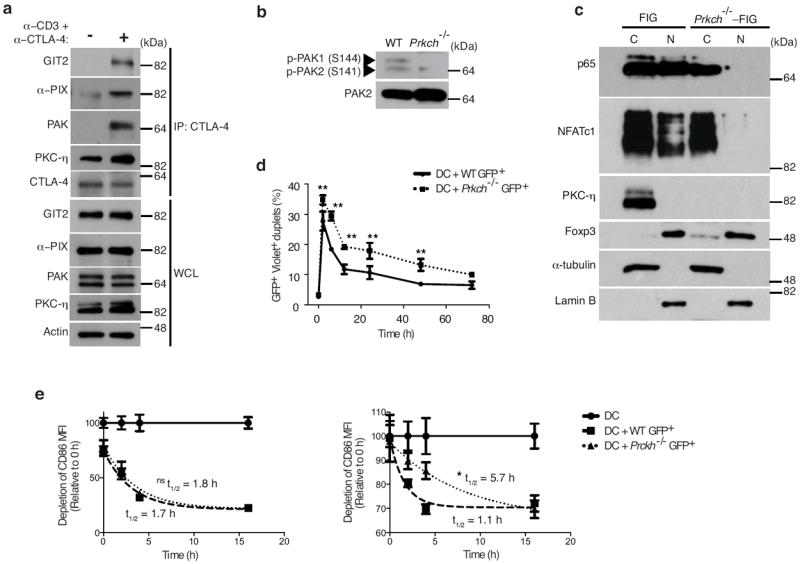
Regulatory T (Treg) cells, which maintain immune homeostasis and self-tolerance, form an immunological synapse (IS) with antigen-presenting cells (APCs). However, signaling events at the Treg cell IS remain unknown. Here we show that the kinase PKC-η associated with CTLA-4 and was recruited to the Treg cell IS. PKC-η-deficient Treg cells displayed defective suppressive activity, including suppression of tumor immunity but not of autoimmune colitis. Phosphoproteomic and biochemical analysis revealed an association between CTLA-4-PKC-η and the GIT2-αPIX-PAK complex, an IS-localized focal adhesion complex. Defective activation of this complex in PKC-η-deficient Treg cells was associated with reduced depletion of CD86 from APCs by Treg cells. These results reveal a CTLA-4-PKC-η signaling axis required for contact-dependent suppression and implicate this pathway as a potential cancer immunotherapy target.


Conflict of interest statement

The authors declare no competing financial interests.

Figures

Figure 1
Figure 1
IS recruitment and CTLA-4 interaction of PKC-η in Treg cells. (a) Immunoblot analysis of T hybridoma cells left unstimulated (-) or stimulated (+) with anti-CD3 plus CD86-Fc for 5 min. CTLA-4 IPs (left and center lanes) or whole cell lysates (WCL) were immunoblotted with the indicated Abs. Arrowheads mark the two PKC-η species. (b) Immunoblot analysis of IPs (left and center lanes) or WCL (right lane) from T hybridoma cells stimulated with anti-CD3 plus CD86-Fc for 5 min. CTLA-4 IPs were left untreated (-) or treated with alkaline phosphatase (AP; +) prior to immunoblotting. (c) Immunoblot analysis of cytosol or nuclear fractions from sorted CD4+CD62L+GFP- (naïve) and CD4+GFP+ (Treg) cells (2 × 10⁶ each) from wild-type FIG mice. Data in (a-c) are representative of at least four experiments. (d) Confocal imaging of PKC-η (top row) or PKC-θ (bottom row) and TCRβ localization in in vitro differentiated iTreg cells from AND TCR-Tg Rag2−/− mice, which were retrovirally transduced with eGFP-tagged mouse PKC-θ or PKC-η 1 d after anti-CD3 and -CD28 stimulation. Sorted GFP+ T cells (~90% FoxP3+ by intracellular staining; not shown) obtained on d 4 and stimulated for 5-10 min by conjugation with MCC-pulsed LPS-stimulated B cells were fixed and analyzed. eGFP-tagged PKC, TCR and nuclear DAPI staining are shown in green, red and blue, respectively. Images are representative of at least 100 cells collected from three independent experiments.
Figure 2
Figure 2
Development of Foxp3+ Treg cells is independent of PKC-η. (a-d) Cell counts (Log10) of CD4+Foxp3+ cells from thymi (a), spleens (b), peripheral lymph nodes (pLN; c) and mesenteric lymph nodes (mLN; d) of 8-12 week-old wild-type or Prkch−/− mice determined by intracellular Foxp3 staining. Each data point represents a single mouse. ns, non significant; *P < 0.05. (e-j) Mean fluorescence intensity (MFI) of Foxp3 (e), TCRβ (f), CTLA-4 (g), CD25 (h), GITR (i) and CD44 (j) expression determined on gated CD4+Foxp3+-cells from wild-type or Prkch−/− mice. (k) IL-10 production (measured by ELISA) by CD4+GFP+ Treg cells from wild-type and Prkch−/− FIG mice, which were stimulated with plate-bound anti-CD3 mAb and CD86-Fc in the presence of IL-2 overnight. For description of FIG mice, see Fig. 3 and the corresponding text.
Figure 3
Figure 3
Contact-dependent suppression by Treg cells depends on PKC-η. (a) In vitro suppression assay measuring the proliferation of CellTrace Violet-labeled naïve B6 CD4+CD25- Teff cells cocultured in the absence (1:0) or presence of Foxp3+ Treg cells from wild-type or Prkch−/−FIG mice at the indicated Teff/Treg cell ratios, and stimulated with anti-CD3 mAb and splenic DCs for 3 d. Percentages of CellTrace Violet-diluting Teff cells were calculated (left panel). The three right panels show representative FACS dot plots of dye-diluting Teff cells cultured with Treg cells at a 1:1 ratio. Data are representative of at least five independent experiments. (b-d) In vivo homeostatic proliferation assay showing the number (Log10) of B6.SJL CD45.1+ naïve T cells recovered from spleens (b), pLN (c) or mLN (d) of recipient Rag1−/− mice 7 d after i.v. transfer of naïve cells (2 × 10⁶) in the absence (none) or presence of FACS-sorted CD4+GFP+ Treg cells (.5 × 106) from FIG or Prkch−/−-FIG mice. Each data point represents a single mouse. (e) Sequential measurements of B16-F10 melanoma growth in groups of Rag1-/- mice (n ≥ 5), which received CD25-depleted B6 splenic cells (1.5 × 10⁷; a source of Teff cells) without or with 0.5 × 10⁶ CD4+GFP+ Treg cells from wild-type or Prkch−/− FIG mice, and were inoculated one day later with tumor cells (2 × 10⁵). Tumor diameters along two perpendicular axes were measured 2-3 times/week. *P < 0.05; **P < 0.01; ***P < 0.001. This experiment is representative of at least three independent experiments.
Figure 4
Figure 4. Cytokine production and serum antibody levels of WT vs. Prkch−/− mice
(a-d) Cytokine expression in culture supernatants of WT or Prkch−/− FACS-sorted CD44hi T cells, which were stimulated with anti-CD3 plus -CD28 mAbs for 24 h and assayed by an ELISA for levels of IL-2 (a), IFNγ (b), IL-4 (c) and IL-17A (d). (e-g) Serum levels of IgE (e), anti-double stranded DNA (f) or anti-histone (g) antibodies in 8-12 week-old wild-type and Prkch−/− mice determined by an ELISA. Each data point represents a single mouse from two pooled experiments. *P < 0.01 **P < 0.001; ***P < 0.0001.
Figure 5
Figure 5
Mapping and biological significance of the CTLA-4-PKC-η interaction sites. (a) Immunoblot analysis of CTLA-4 IPs or WCL from JTAg cells, which were cotransfected with the indicated PKC-η vectors plus wild-type CTLA-4 and stimulated as in Fig. 1a. IgH, heavy chain of the precipitating antibody. Schematic representation of human PKC-η and its phosphorylation sites is shown on top. Data are representative of at leas five independent experiments. (b-d) In vivo homeostatic proliferation assay performed as described in Fig. 3b-d showing the number (Log10) of B6.SJL CD45.1+ naïve T cells, which were recovered from spleens (b), pLN (c) or mLN (d) of recipient Rag1−/− mice 10 d post i.v. transfer of naive cells (2 × 10⁶) in the absence (vector) or presence of FACS-sorted rCD2+CD4+GFP+ Treg cells (.5 × 106). Treg cells were derived from Prkch−/− BM mouse chimeras reconstituted with wild-type PKC-η or a CTLA-4 non-interacting PKC-η-S28A, S32A using retroviral pMIG-IRES-rCD2 vector. Each data point represents a single mouse. ns, non significant; *P < 0.05; **P < 0.01; ***P < 0.001. (e) Immunoblot analysis of CTLA-4 IPs or WCL from JTAg cells cotransfected with the indicated CTLA-4 vectors plus wild-type PKC-η, and processed as in (a). Schematic representation of mouse CTLA-4 is shown on top.
Figure 6
Figure 6
CTLA-4-PKC-η recruits GIT-PIX-PAK complex and modulates Treg cell-APC interaction. (a) Immunoblot analysis of cytosolic (C) and nuclear (N) fractions of FACS-sorted wild-type or Prkch−/− FIG CD4+GFP+ Treg cells, which were stimulated with anti-CD3ε plus -CTLA-4 mAbs for 5 min. (b) Immunoblot analysis of CTLA-4 IPs or WCL of FACS-sorted GFP+ Treg cells derived from FIG mice and left unstimulated (-) or stimulated (+) with ani-CD3 plus anti-CTLA-4 antibodies for 5 min. (c) Expression of phospho-PAK and total PAK2 in lysates of CD4+GFP+ Treg cells from wild-type or Prkch−/− FIG mice determined by immunoblotting with the corresponding antibodies. (d) Conjugation assay measuring formation of cell doublets between FACS-sorted CD4+GFP+ wild-type or Prkch−/− FIG Treg and CellTrace Violet-labeled splenic DCs at different times during a 3 d coculture period in the presence of anti-CD3 mAb and IL-2. Percentages of GFP+ and Violet+ double-positive doublets are shown. *P < 0.05; **P <0.001. (e) CD86 depletion from APCs cocultured in the absence (circles) or presence of FACS-sorted CD4+GFP+ wild-type (squares) or Prkch−/− (triangles) FIG Treg cells. A first set of CD45.2+ splenic DCs was cultured for 9 h in the presence of anti-CD3 mAb and IL-2 prior to the addition of a second set of CD45.1+ splenic DCs. The geometric mean fluorescence intensity of CD86 was enumerated on gated CD11c+ Annexin V CD45.2+ and CD11c+ Annexin V CD45.1+ cells, respectively. The t1/2 values of CD86 decay curves were calculated using the GraphPad Prism™ program. This experiment is representative of three independent experiments. ns, non significant; *P < 0.05.

Comment in

  • New inhibitory signaling by CTLA-4.
    Wülfing C, Tunbridge HM, Wraith DC. Wülfing C, et al. Nat Immunol. 2014 May;15(5):408-9. doi: 10.1038/ni.2870. Nat Immunol. 2014. PMID: 24747703 No abstract available.

References

    1. Bennett CL, et al. The immune dysregulation, polyendocrinopathy, enteropathy, X-linked syndrome (IPEX) is caused by mutations of FOXP3. Nat Genet. 2001;27:20–21. - PubMed
    1. Fontenot JD, Gavin MA, Rudensky AY. Foxp3 programs the development and function of CD4+CD25+ regulatory T cells. Nat Immunol. 2003;4:330–336. - PubMed
    1. Hori S, Nomura T, Sakaguchi S. Control of regulatory T cell development by the transcription factor Foxp3. Science. 2003;299:1057–1061. - PubMed
    1. Zanin-Zhorov A, et al. Protein kinase C-theta mediates negative feedback on regulatory T cell function. Science. 2010;328:372–376. - PMC - PubMed
    1. Collins AV, et al. The interaction properties of costimulatory molecules revisited. Immunity. 2002;17:201–210. - PubMed

Publication types