

Transcription of two adjacent carbohydrate utilization gene clusters in Bifidobacterium breve UCC2003 is controlled by LacI- and repressor open reading frame kinase (ROK)-type regulators
- PMID: 24705323
- PMCID: PMC4054134
- DOI: 10.1128/AEM.00130-14
Transcription of two adjacent carbohydrate utilization gene clusters in Bifidobacterium breve UCC2003 is controlled by LacI- and repressor open reading frame kinase (ROK)-type regulators
Abstract
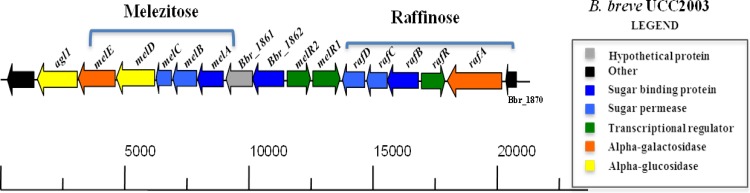
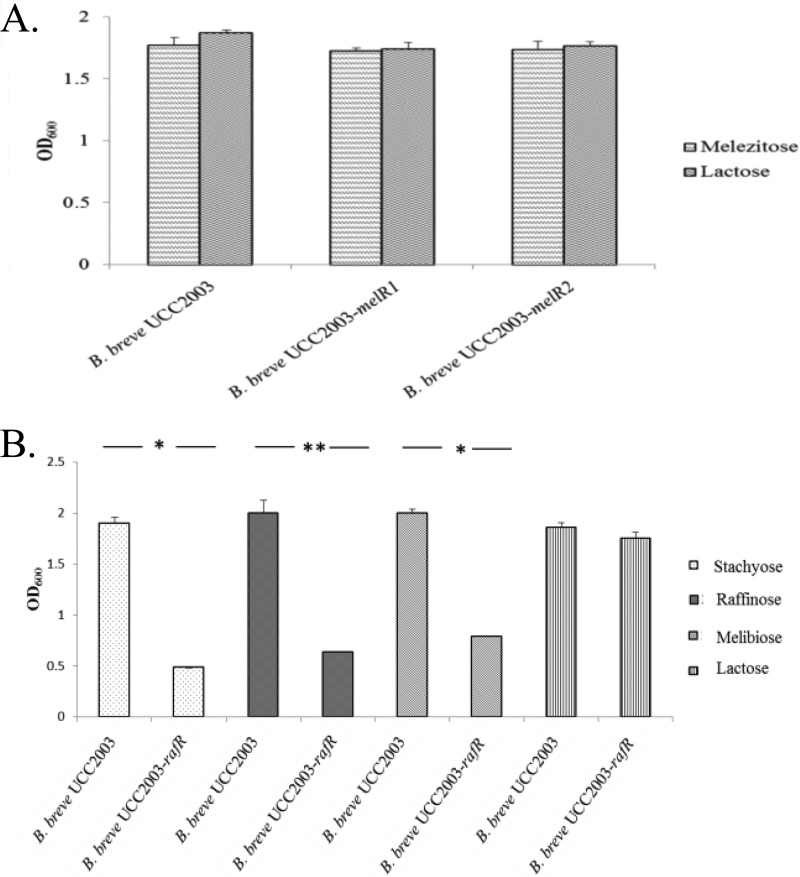
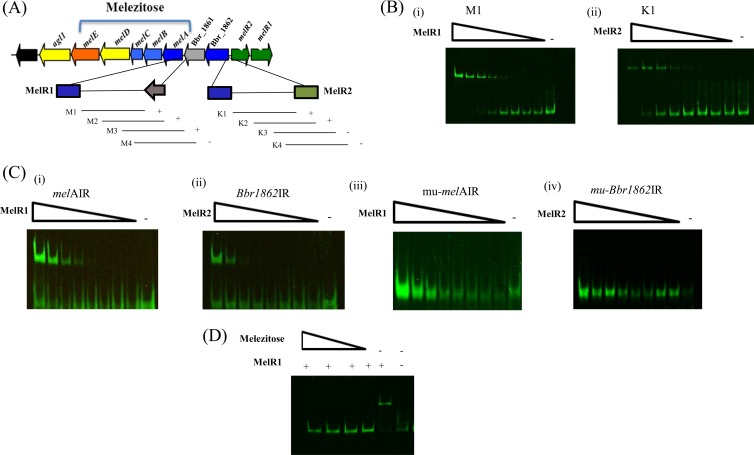
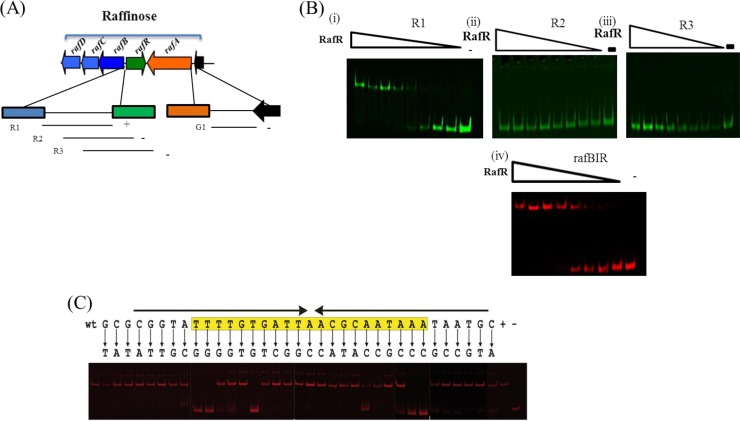
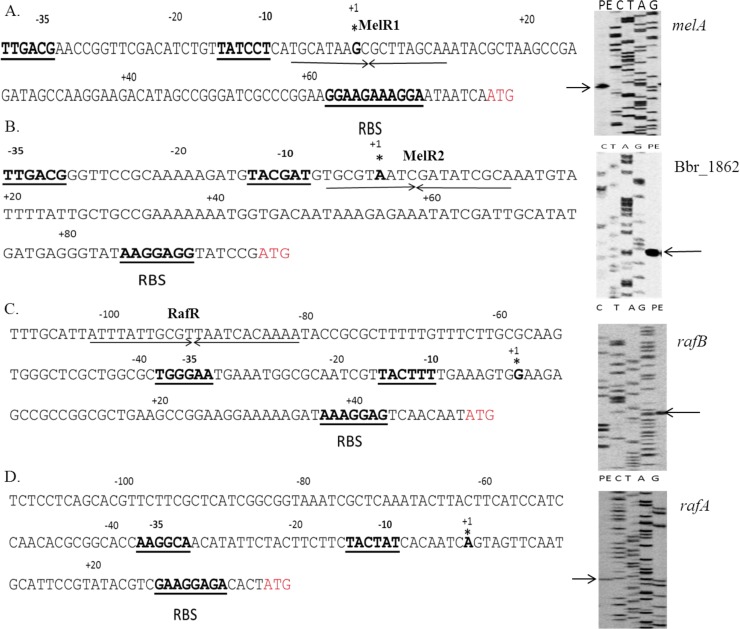
Members of the genus Bifidobacterium are commonly found in the gastrointestinal tracts of mammals, including humans, where their growth is presumed to be dependent on various diet- and/or host-derived carbohydrates. To understand transcriptional control of bifidobacterial carbohydrate metabolism, we investigated two genetic carbohydrate utilization clusters dedicated to the metabolism of raffinose-type sugars and melezitose. Transcriptomic and gene inactivation approaches revealed that the raffinose utilization system is positively regulated by an activator protein, designated RafR. The gene cluster associated with melezitose metabolism was shown to be subject to direct negative control by a LacI-type transcriptional regulator, designated MelR1, in addition to apparent indirect negative control by means of a second LacI-type regulator, MelR2. In silico analysis, DNA-protein interaction, and primer extension studies revealed the MelR1 and MelR2 operator sequences, each of which is positioned just upstream of or overlapping the correspondingly regulated promoter sequences. Similar analyses identified the RafR binding operator sequence located upstream of the rafB promoter. This study indicates that transcriptional control of gene clusters involved in carbohydrate metabolism in bifidobacteria is subject to conserved regulatory systems, representing either positive or negative control.
Figures
Similar articles
-
Glycosulfatase-Encoding Gene Cluster in Bifidobacterium breve UCC2003.Appl Environ Microbiol. 2016 Oct 27;82(22):6611-6623. doi: 10.1128/AEM.02022-16. Print 2016 Nov 15. Appl Environ Microbiol. 2016. PMID: 27590817 Free PMC article.
-
A GntR-type transcriptional repressor controls sialic acid utilization in Bifidobacterium breve UCC2003.FEMS Microbiol Lett. 2015 Feb;362(4). doi: 10.1093/femsle/fnu056. Epub 2014 Dec 11. FEMS Microbiol Lett. 2015. PMID: 25688064
-
Metabolism of four α-glycosidic linkage-containing oligosaccharides by Bifidobacterium breve UCC2003.Appl Environ Microbiol. 2013 Oct;79(20):6280-92. doi: 10.1128/AEM.01775-13. Epub 2013 Aug 2. Appl Environ Microbiol. 2013. PMID: 23913435 Free PMC article.
-
Ribose utilization by the human commensal Bifidobacterium breve UCC2003.Microb Biotechnol. 2010 May;3(3):311-23. doi: 10.1111/j.1751-7915.2009.00152.x. Epub 2009 Oct 15. Microb Biotechnol. 2010. PMID: 21255330 Free PMC article.
-
Bifidobacterium breve UCC2003 surface exopolysaccharide production is a beneficial trait mediating commensal-host interaction through immune modulation and pathogen protection.Gut Microbes. 2012 Sep-Oct;3(5):420-5. doi: 10.4161/gmic.20630. Epub 2012 Jun 20. Gut Microbes. 2012. PMID: 22713271 Review.
Cited by
-
Experimental determination and characterization of the gap promoter of Bifidobacterium bifidum S17.Bioengineered. 2014;5(6):371-7. doi: 10.4161/bioe.34423. Epub 2014 Oct 30. Bioengineered. 2014. PMID: 25482086 Free PMC article.
-
Transcriptional Regulation of Carbohydrate Utilization Pathways in the Bifidobacterium Genus.Front Microbiol. 2016 Feb 9;7:120. doi: 10.3389/fmicb.2016.00120. eCollection 2016. Front Microbiol. 2016. PMID: 26903998 Free PMC article.
-
Gene-trait matching among Bifidobacterium dentium strains reveals various glycan metabolism loci including a strain-specific fucosyllactose utilization cluster.Front Microbiol. 2025 May 12;16:1584694. doi: 10.3389/fmicb.2025.1584694. eCollection 2025. Front Microbiol. 2025. PMID: 40421466 Free PMC article.
-
Characterization of DNA Binding Sites of RokB, a ROK-Family Regulator from Streptomyces coelicolor Reveals the RokB Regulon.PLoS One. 2016 May 4;11(5):e0153249. doi: 10.1371/journal.pone.0153249. eCollection 2016. PLoS One. 2016. PMID: 27145180 Free PMC article.
-
Glycosulfatase-Encoding Gene Cluster in Bifidobacterium breve UCC2003.Appl Environ Microbiol. 2016 Oct 27;82(22):6611-6623. doi: 10.1128/AEM.02022-16. Print 2016 Nov 15. Appl Environ Microbiol. 2016. PMID: 27590817 Free PMC article.
References
-
- Miyake T, Watanabe K, Watanabe T, Oyaizu H. 1998. Phylogenetic analysis of the genus Bifidobacterium and related genera based on 16S rDNA sequences. Microbiol. Immunol. 42:661–667 - PubMed
-
- Tissier H. 1900. Recherchers sur la flora intestinale normale pathologique du nourisson. Thesis, University of Paris, Paris, France
-
- Tissier H. 1906. The treatment of intestinal infections by the method of transformation of the bacterial intestinal flora. C. R. Soc. Biol. 60:359–361
Publication types
MeSH terms
Substances
LinkOut - more resources
Full Text Sources
Other Literature Sources
Molecular Biology Databases
Miscellaneous
