. 2014 Aug 15;23(16):4215-31.
doi: 10.1093/hmg/ddu140. Epub 2014 Apr 4.

Tbx1 is required autonomously for cell survival and fate in the pharyngeal core mesoderm to form the muscles of mastication

Affiliations

Tbx1 is required autonomously for cell survival and fate in the pharyngeal core mesoderm to form the muscles of mastication

Ping Kong et al. Hum Mol Genet. .

Abstract

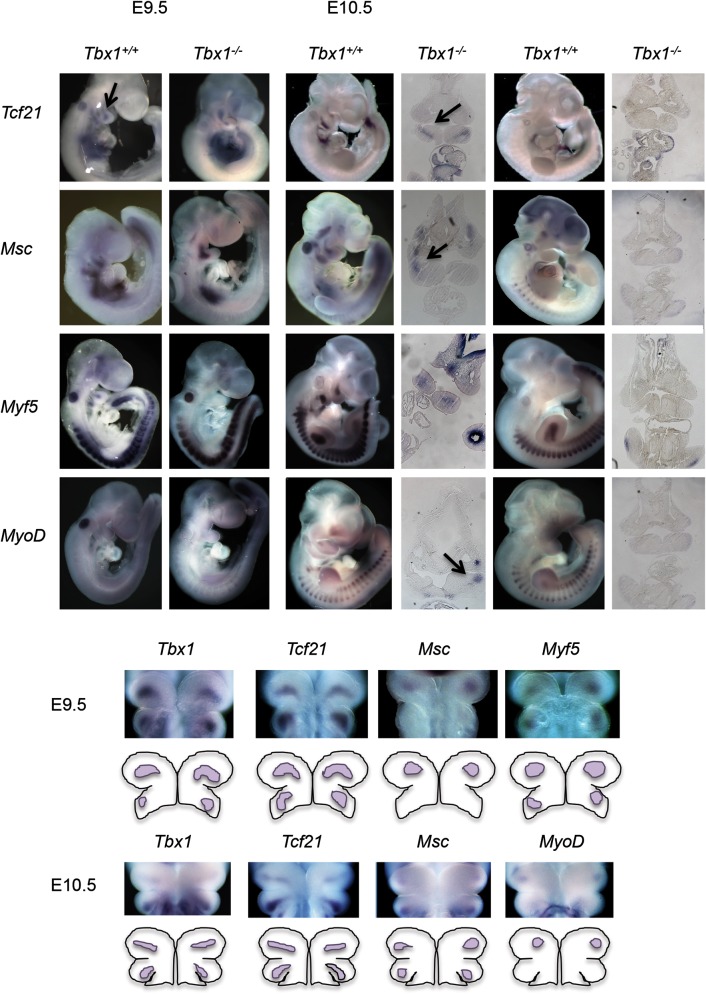
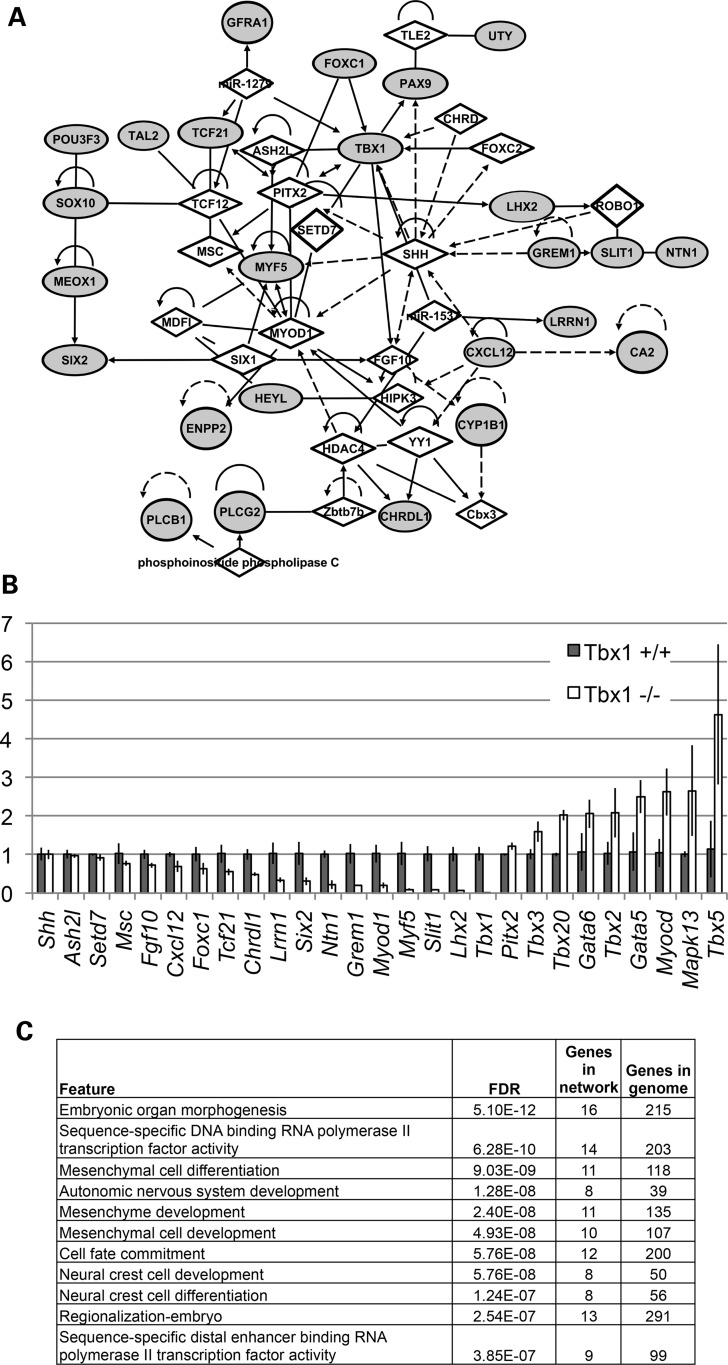
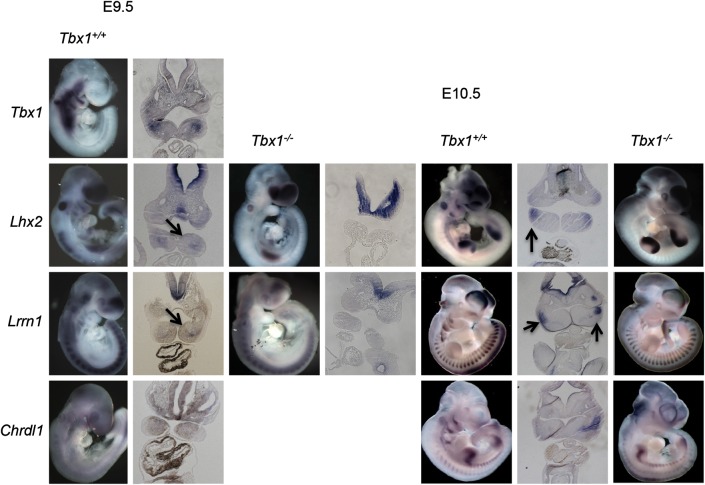
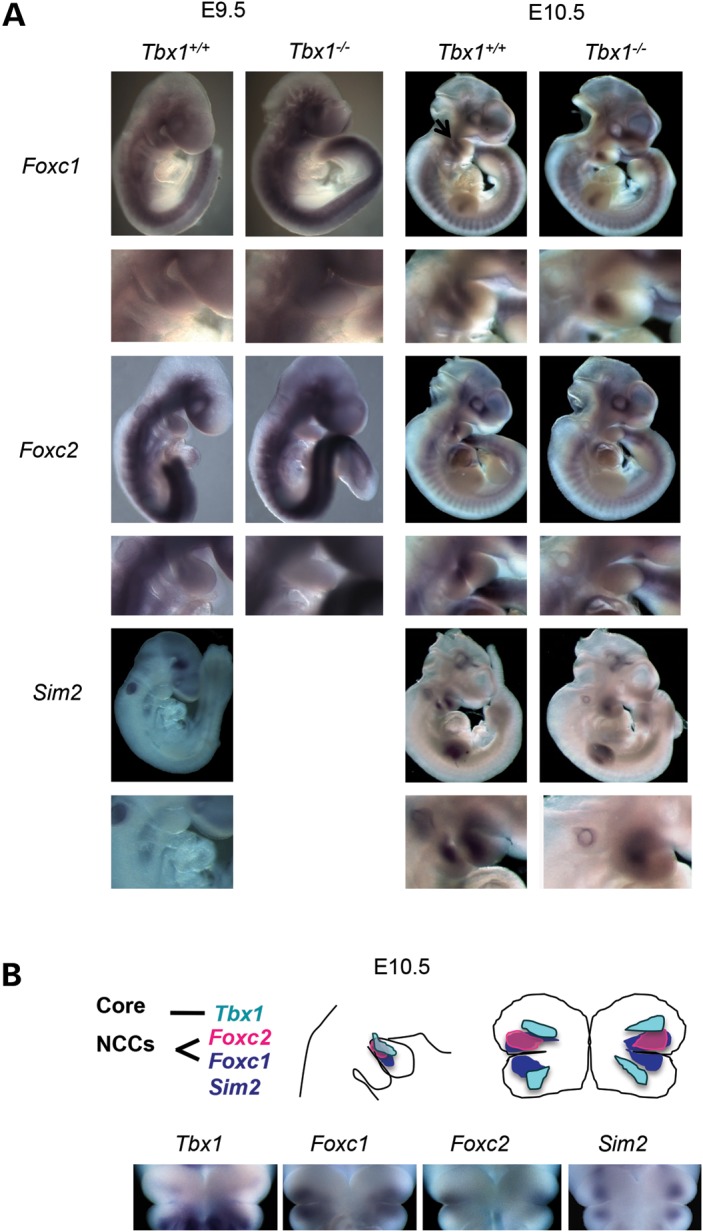
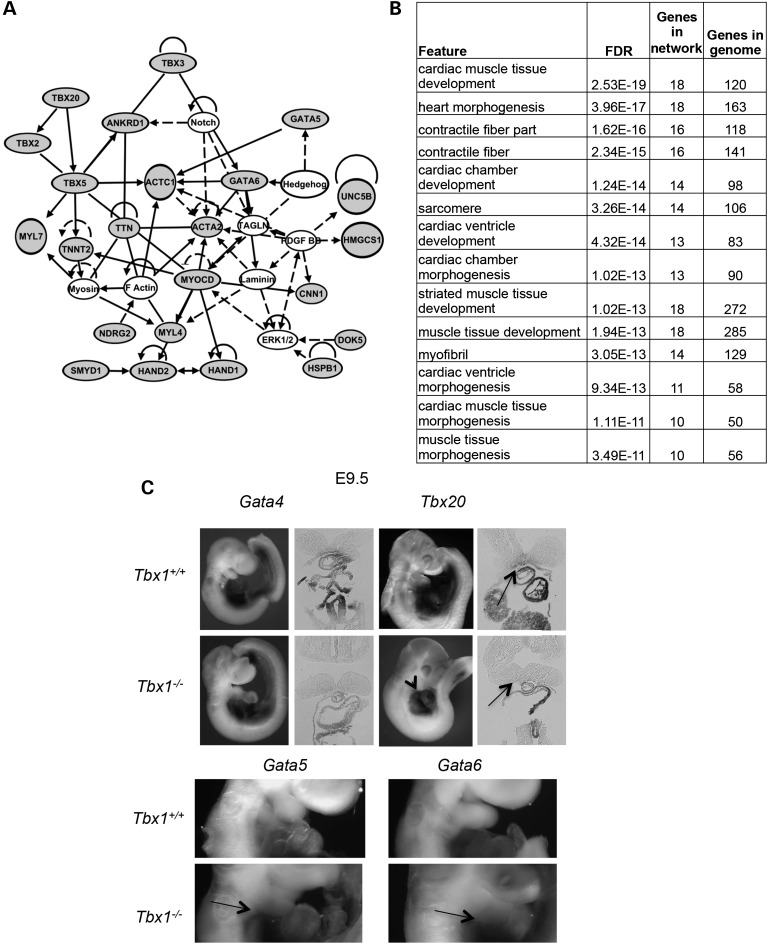
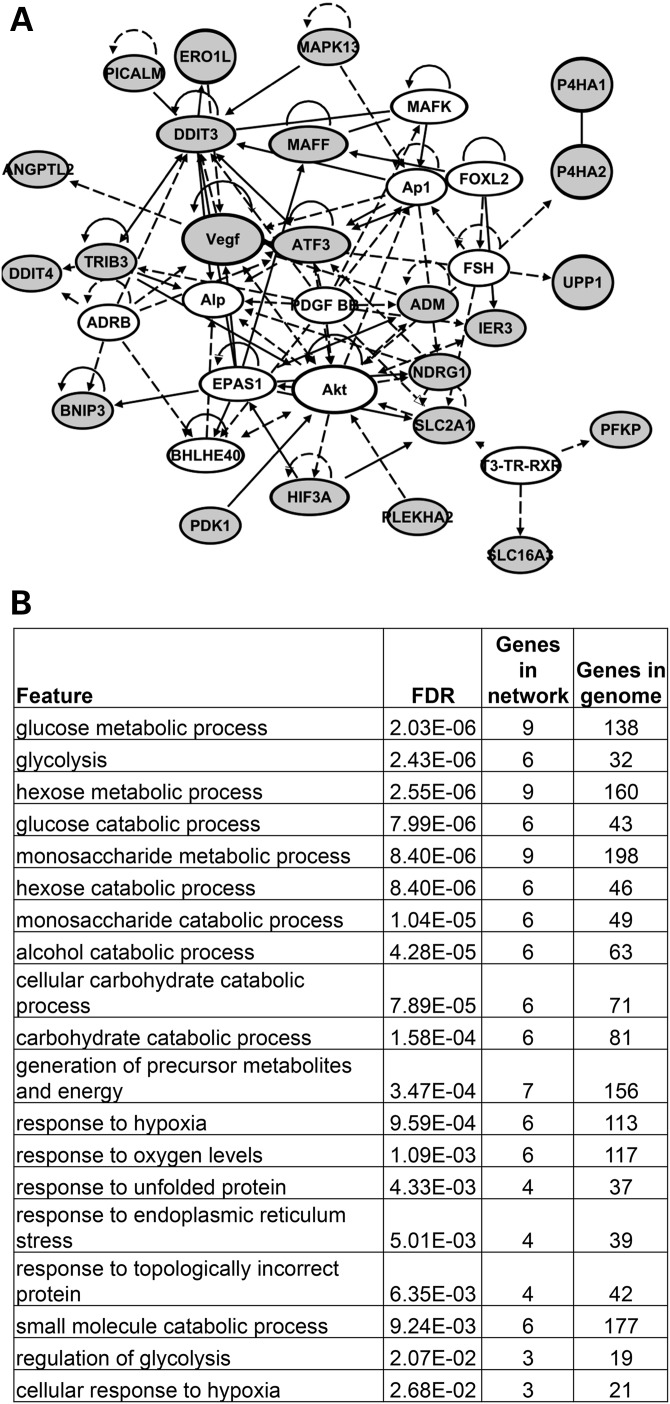
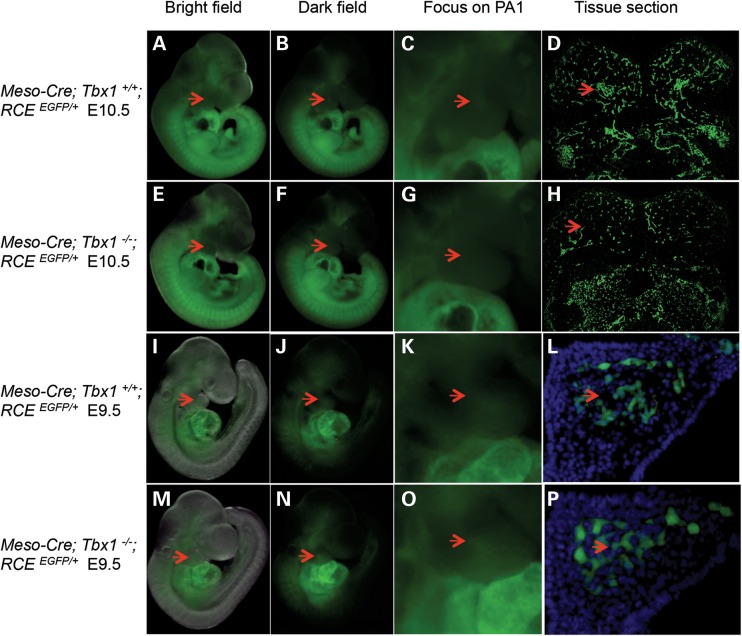
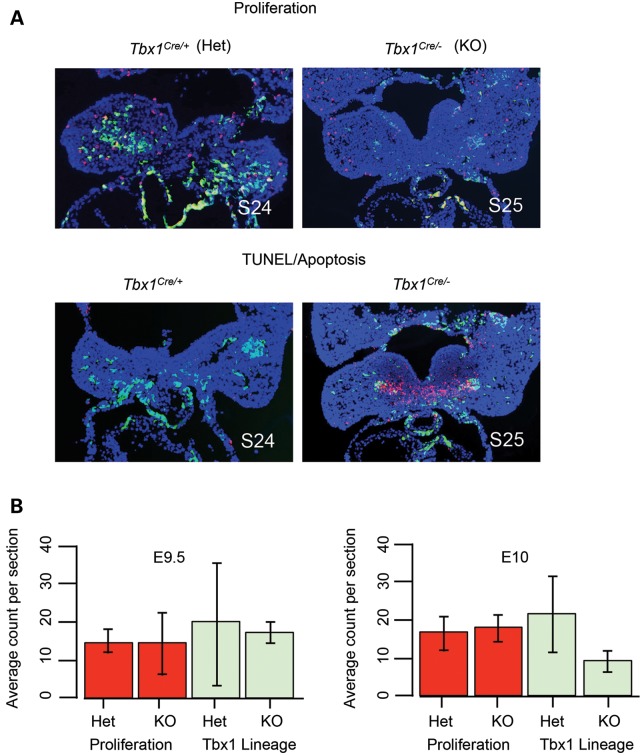
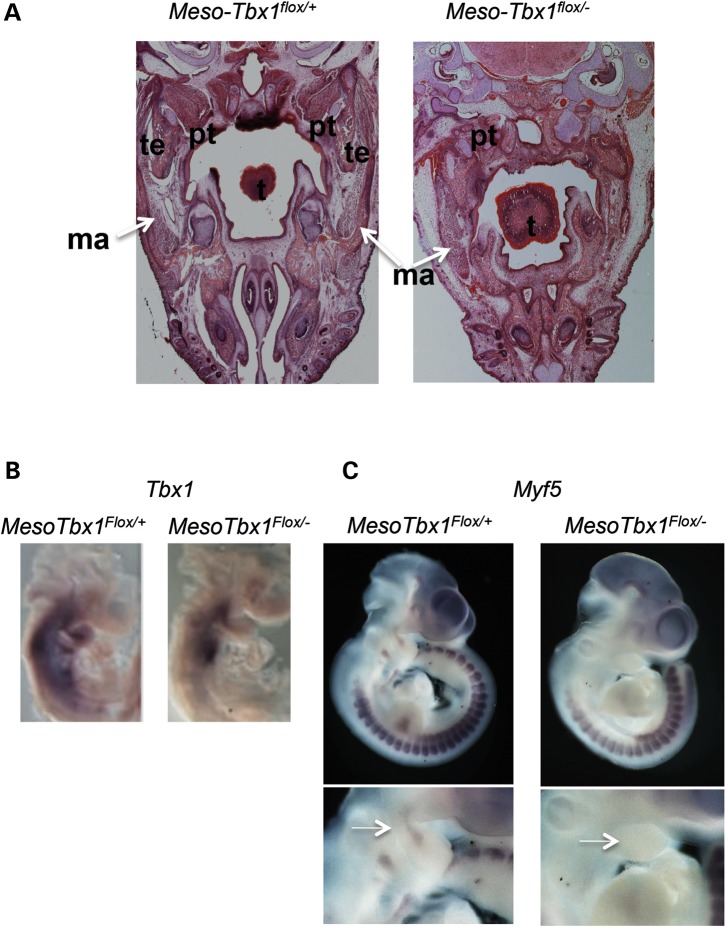
Velo-cardio-facial/DiGeorge syndrome, also known as 22q11.2 deletion syndrome, is a congenital anomaly disorder characterized by craniofacial anomalies including velo-pharyngeal insufficiency, facial muscle hypotonia and feeding difficulties, in part due to hypoplasia of the branchiomeric muscles. Inactivation of both alleles of mouse Tbx1, encoding a T-box transcription factor, deleted on chromosome 22q11.2, results in reduction or loss of branchiomeric muscles. To identify downstream pathways, we performed gene profiling of microdissected pharyngeal arch one (PA1) from Tbx1(+/+) and Tbx1(-/-) embryos at stages E9.5 (somites 20-25) and E10.5 (somites 30-35). Basic helix-loop-helix (bHLH) transcription factors were reduced, while secondary heart field genes were increased in expression early and were replaced by an increase in expression of cellular stress response genes later, suggesting a change in gene expression patterns or cell populations. Lineage tracing studies using Mesp1(Cre) and T-Cre drivers showed that core mesoderm cells within PA1 were present at E9.5 but were greatly reduced by E10.5 in Tbx1(-/-) embryos. Using Tbx1(Cre) knock-in mice, we found that cells are lost due to apoptosis, consistent with increase in expression of cellular stress response genes at E10.5. To determine whether Tbx1 is required autonomously in the core mesoderm, we used Mesp1(Cre) and T-Cre mesodermal drivers in combination with inactivate Tbx1 and found reduction or loss of branchiomeric muscles from PA1. These mechanistic studies inform us that Tbx1 is required upstream of key myogenic genes needed for core mesoderm cell survival and fate, between E9.5 and E10.5, resulting in formation of the branchiomeric muscles.


Figures

Figure 1.
Figure 1.
Basic HLH transcription factor genes, Tcf21, Msc, Myf5 and MyoD, in Tbx1+/+ versus Tbx1−/− embryos at E9.5 and E10.5. Lateral views of Tbx1+/+ versus Tbx1−/− embryos at E9.5 (somite count, 20–25) and E10.5 (somite count, 30–40) are shown following whole-mount in situ hybridization with probes for Tcf21, Msc, Myf5 and MyoD. Coronal histological sections of the PA1 region from E10.5 embryos are shown next to the whole-mount images. Arrow points to core mesoderm expression domain of Tcf21 in PA1. The image below shows whole-mount coronal views of the first and second pharyngeal arch in Tbx1+/+ embryos at E9.5 and E10.5 after whole-mount in situ hybridization, using antisense probes to the four bHLH genes. Cartoons are shown below to depict expression patterns of individual probes.
Figure 2.
Figure 2.
Gene network of PA1 genes reduced in expression at E9.5 in Tbx1−/− embryos. (A) The network of genes that were reduced in expression in Tbx1−/− embryos when compared with Tbx1+/+ embryos (>1.5-fold change, P < 0.05) was created using IPA (http://www.ingenuity.com/products/ipa). The top network is depicted here. The genes reduced in expression are highlighted by gray fill, and additional genes connected to them based on IPA network analysis are indicated as diamonds. The lines indicate relationships between genes that could directly or indirectly interact. Genes reduced in expression but not linked to this network can be found in the Supplementary Material, Table S1. (B) Quantitative RT-PCR of PA1 tissue from Tbx1+/+ and Tbx1−/− embryos at E9.5. The X-axis indicates genes analyzed and Y-axis represents fold change of expression in PA1 tissue from Tbx1−/− relative to Tbx1+/+controls at E9.5. Error bars, s.e.m. (n = 3). (C) Genes reduced in expression in Tbx1−/− embryos at E9.5 were analyzed at the Genemania website (http://www.genemania.org/) to identify top enriched functions. We provide the FDR (false discovery rate) score estimated in Genemania by the Benjamini–Hochberg correction.
Figure 3.
Figure 3.
Tbx1, Lhx2, Lrrn1 and Chrdl1 expression in the core mesoderm in Tbx1+/+ versus Tbx1−/− embryos at E9.5 and E10.5. Lateral views of whole-mount in situ hybridization of Tbx1+/+ and Tbx1−/− embryos at E9.5 and E10.5 with antisense probes for Tbx1 (Wt only), Lhx2, Lrrn1 and Chrdl1. Coronal tissue sections from a subset of the whole-mount stained embryos are shown adjacent to the whole-mount images. Chrdl1 is not expressed in the core mesoderm in Tbx1+/+ embryos at E9.5; thus, no images are shown for Tbx1−/− embryos at this stage. Lhx2, Lrrn1 and Chrdl1 were not expressed in the core mesoderm in Tbx1−/− embryos so only whole-mount images are shown.
Figure 4.
Figure 4.
Foxc1, Foxc2 and Sim2 expression in PA1 in Tbx1+/+ versus Tbx1−/− embryos at E9.5 and E10.5. (A) Lateral views of whole-mount in situ hybridization of probes for Foxc1, Foxc2 and Sim2 in Tbx1+/+ and Tbx1−/− embryos at E9.5 and E10.5. Enlarged lateral views of the PA1 region in the whole-mount specimens is shown below each whole embryo view. (B) Cartoon of lateral and coronal views (shown below) of Tbx1, Foxc1, Foxc2 and Sim2. Expression domain of Tbx1 is in the core mesoderm.
Figure 5.
Figure 5.
Ectopic expression of cardiac genes in PA1 in Tbx1+/+ versus Tbx1−/− embryos at E9.5. (A) The network downstream of Tbx1 was created using genes that had a >1.5-fold increase, P < 0.05 by microarray analysis (gray fill). Genes not changed in expression significantly in the microarray or qRT–PCR assay, but connected to those based upon the software generated connections, are indicated as uncolored circles. The lines indicate relationships between genes that could be direct or indirect in nature. Genes increased in expression but not linked to the network were removed but can be found in the Supplementary Material, Table S1. (B) Genes increased in expression in Tbx1−/− embryos at E9.5 were analyzed at the Genemania website to identify top enriched functions. We provide the FDR score estimated in Genemania by the Benjamini–Hochberg correction. (C) Whole-mount in situ hybridization was performed on in Tbx1+/+ versus Tbx1−/− embryos at E9.5 with probes to the genes indicated. Tissue sections are shown adjacent to whole embryo images. The arrows in Tbx20 images point to regions of ectopic expression. Regions of ectopic expression of Gata5 and Gata6 in Tbx1+/+ versus Tbx1−/− embryos are shown as arrows in the cropped images.
Figure 6.
Figure 6.
Ectopic expression of hypoxia and stress response pathway genes in PA1 in Tbx1+/+ versus Tbx1−/− embryos at E10.5. (A) The network of genes that were reduced in expression in Tbx1−/− embryos when compared with Tbx1+/+ embryos (>1.5-fold change, P < 0.05) was created using IPA. The top network is depicted here. The genes increased in expression are highlighted in orange. The lines indicate relationships between genes that could directly or indirectly interact. Genes increased in expression but not linked to this network can be found in the Supplementary Material, Table S2. (B) Genes increased in expression in Tbx1−/− embryos at E10.5 were uploaded to the Genemania website to identify top enriched functions.
Figure 7.
Figure 7.
Mesodermal fate mapping in Tbx1+/+ versus Tbx1−/− embryos at E9.5 and E10.5. Mesodermal fate mapping was performed using Mesp1Cre with T-Cre alleles and RCEEGFP/+ mice in Tbx1+/+ versus Tbx1−/− littermates at E9.5 (IP) and E10.5 (AH). Lateral views of Tbx1+/+ (A–D and I–L) and Tbx1−/− (E–H and M–P) mutants are shown as bright (A, E, I and M) and darkfield (B, F, J and N) views. The red arrow points to the region of the presence or absence of core mesodermal tissue in Tbx1+/+ versus Tbx1−/− at E9.5 and E10.5. An enlarged image of the PA1 region is shown to the right of the images (C, G, K and O). On the far right are coronal cryosections of the same embryos depicting the core mesodermal cells (D, H, L and P). Dapi stain was used to visualize PA1 at E9.5 (L and P).
Figure 8.
Figure 8.
Proliferation and apoptosis of PA1 in Tbx1+/+ versus Tbx1−/− embryos. (A) Immunofluorescence images of tissue sections to visualize the Tbx1 lineage (GFP, green) and either cell proliferation (anti-phospho Histone H3 (Ser10); red fluorescence; top) or apoptosis (TUNEL); red fluorescence; bottom) in Tbx1 heterozygous (Het) and homozygous mutant (KO) embryos are shown. Dapi fluorescent stain to visualize nuclei and identify the tissue is shown in blue. The somite counts of the Tbx1+/+ and Tbx1−/− embryos are indicated (S24; S25). (B) Cell proliferation analysis. Statistical analysis was performed to determine whether cell proliferation was the same or different between Tbx1 heterozygous and homozygous null mutant embryos. The bar graph depicts average count per section with error bars from Student's t-test indicated.
Figure 9.
Figure 9.
Mesodermal Tbx1 is required to form the muscles of mastication. (A) Transverse histological sections of Mesp1Cre/+; T-Cre; Tbx1flox/+ and Mesp1Cre/+; T-Cre; Tbx1flox/− (MesoTbx1flox/+ or MesoTbx1flox/−) embryos at E17.5 stained with hematoxylin and eosin. Adipocytes have largely replaced muscles of mastication (right). The masseter muscle is present unilaterally, but hypoplastic, and a pterygoid muscle is present unilaterally (additional images are in the Supplementary Material, Fig. S3), but again, is severely hypoplastic. ma = masseter. (B) Lateral views of whole-mount in situ hybridization of antisense probe for Tbx1 in MesoTbx1flox/+ and MesoTbx1flox/− littermates at E9.5. Mesodermal expression of Tbx1 in heterozygous embryos is greatly reduced, but still present in conditional mutants. (C) Lateral views of whole-mount in situ hybridization of antisense probe for Myf5 in MesoTbx1flox/+ and MesoTbx1flox/− littermates at E10.5. Enlarged pharyngeal region from in situ hybridization images are shown below whole embryo views. Arrow points to the Myf5 core mesoderm expression domain. Expression was diminished in conditional null mutant embryos.

Similar articles

Cited by

References

    1. Bryson-Richardson R.J., Currie P.D. The genetics of vertebrate myogenesis. Nat. Rev. Genet. 2008;9:632–646. - PubMed
    1. Shprintzen R.J. Velo-cardio-facial syndrome: 30 years of study. Dev. Dis. Res. Rev. 2008;14:3–10. - PMC - PubMed
    1. Shprintzen R.J., Marrinan E. Velopharyngeal insufficiency: diagnosis and management. Curr. Opin. Otolaryngol. Head Neck Surg. 2009;17:302–307. - PMC - PubMed
    1. Zim S., Schelper R., Kellman R., Tatum S., Ploutz-Snyder R., Shprintzen R. Thickness and histologic and histochemical properties of the superior pharyngeal constrictor muscle in velocardiofacial syndrome. Arch. Facial Plast. Surg. 2003;5:503–510. - PubMed
    1. Lypka M., Bidros R., Rizvi M., Gaon M., Rubenstein A., Fox D., Cronin E. Posterior pharyngeal augmentation in the treatment of velopharyngeal insufficiency: a 40-year experience. Ann. Plast. Surg. 2010;65:48–51. - PubMed

Publication types