. 2014 May:242:243-55.
doi: 10.1016/j.jmr.2014.02.010. Epub 2014 Mar 1.

Minimum acquisition methods for simultaneously imaging T(1), T(2), and proton density with B(1) correction and no spin-echoes

Affiliations

Minimum acquisition methods for simultaneously imaging T(1), T(2), and proton density with B(1) correction and no spin-echoes

Guan Wang et al. J Magn Reson. 2014 May.

Abstract

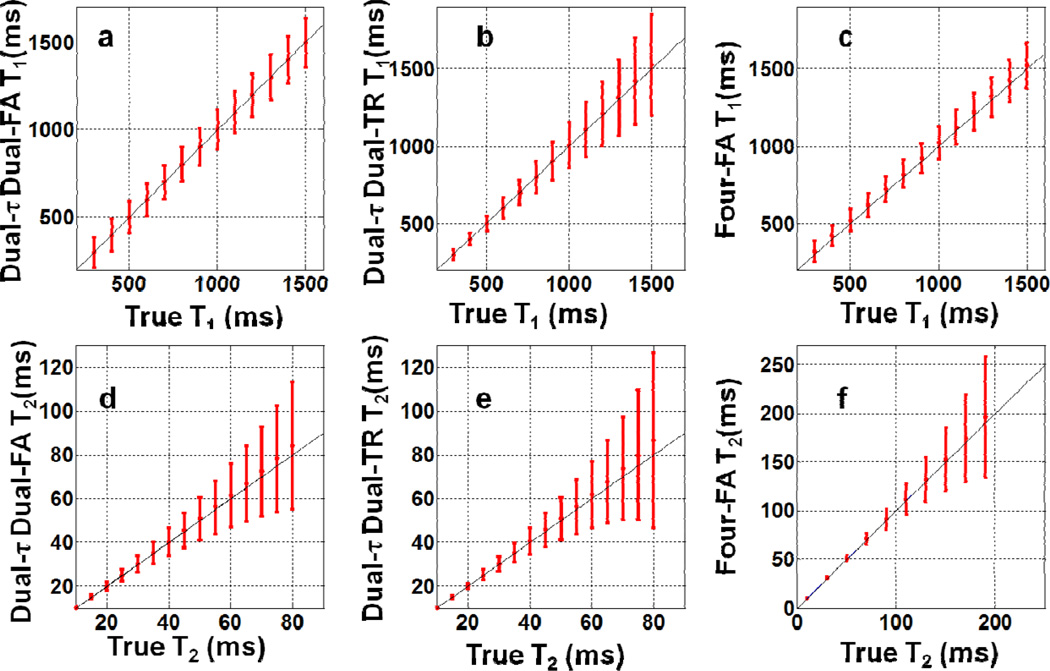
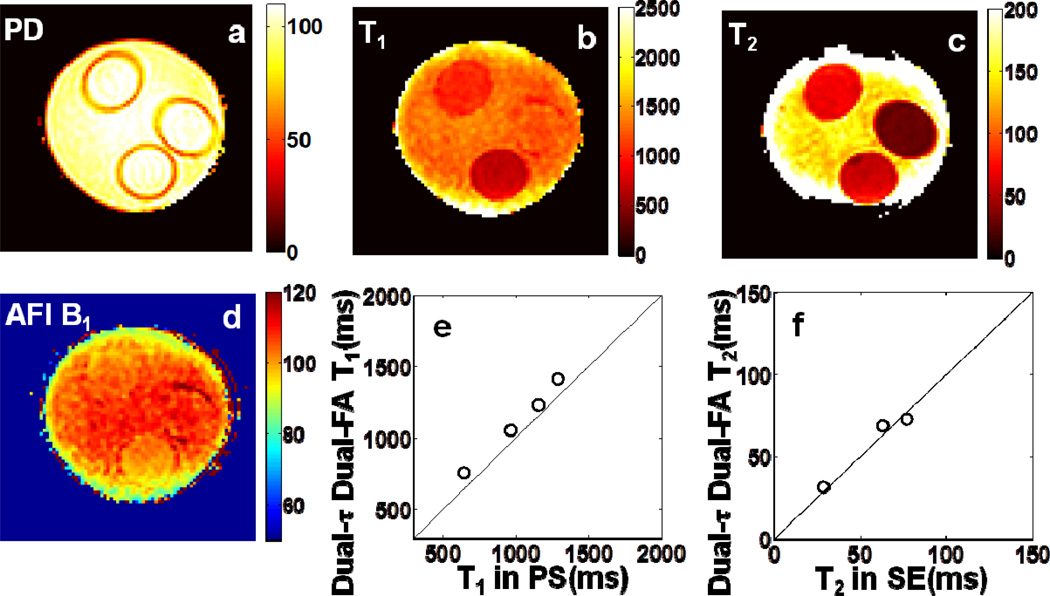
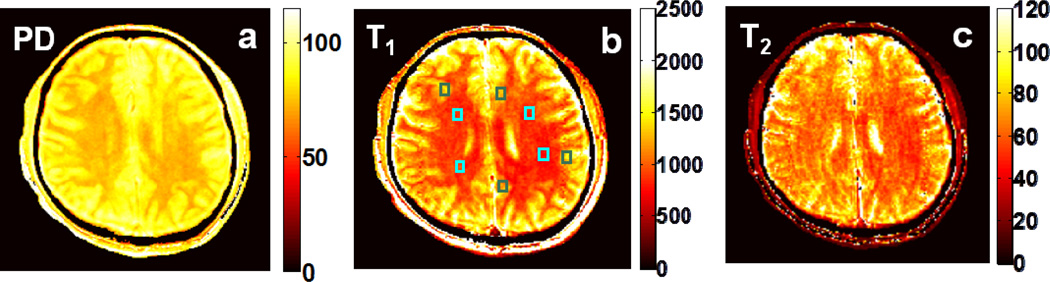
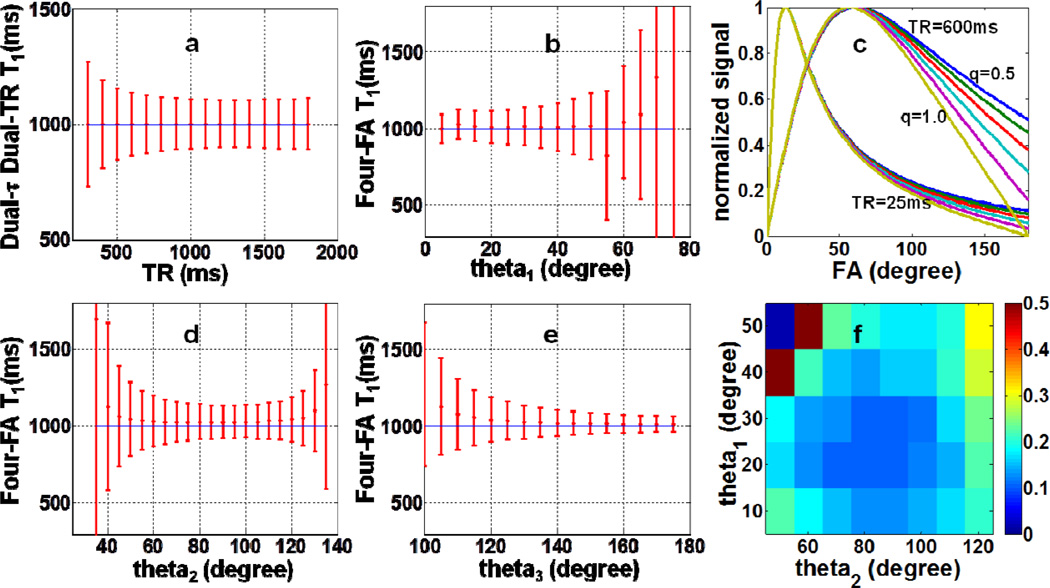
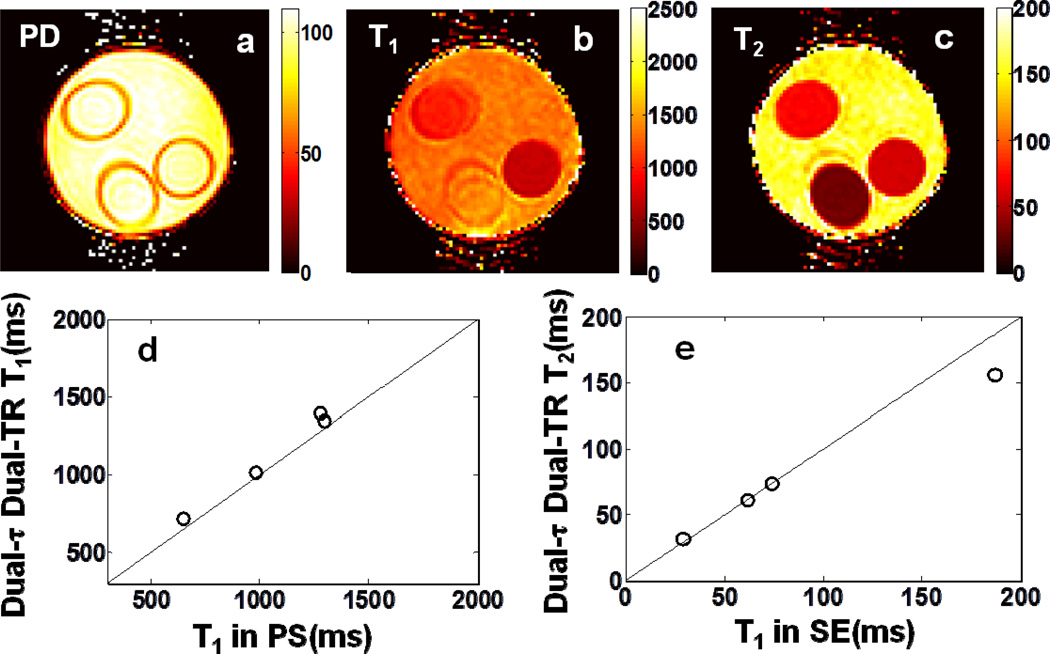
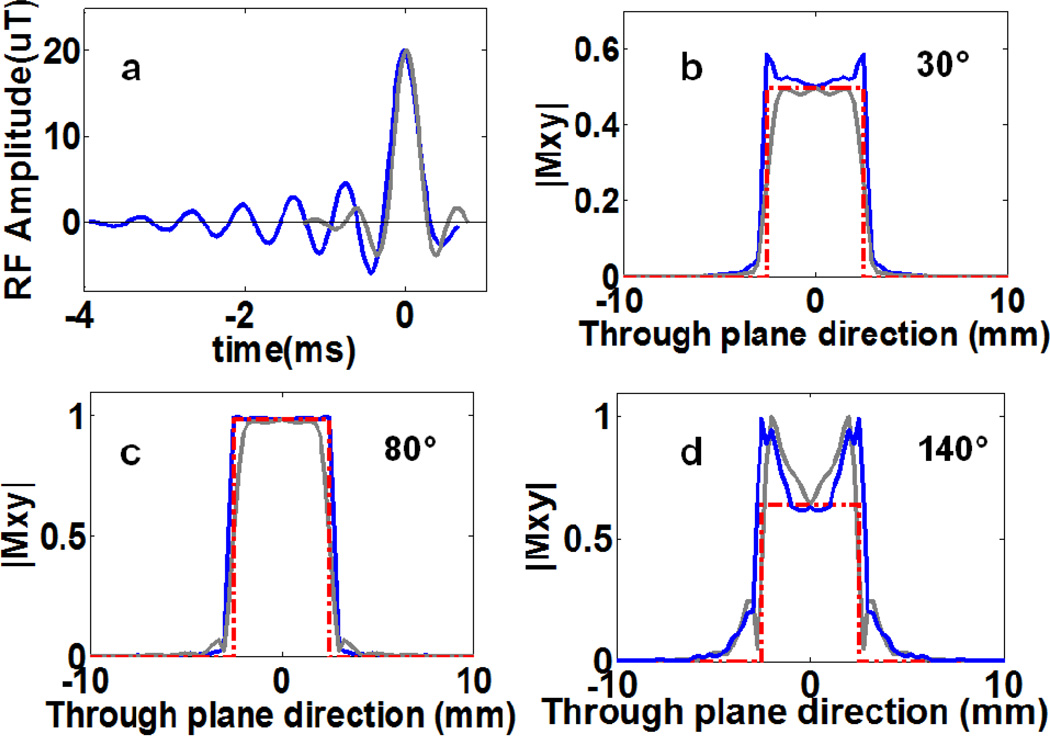
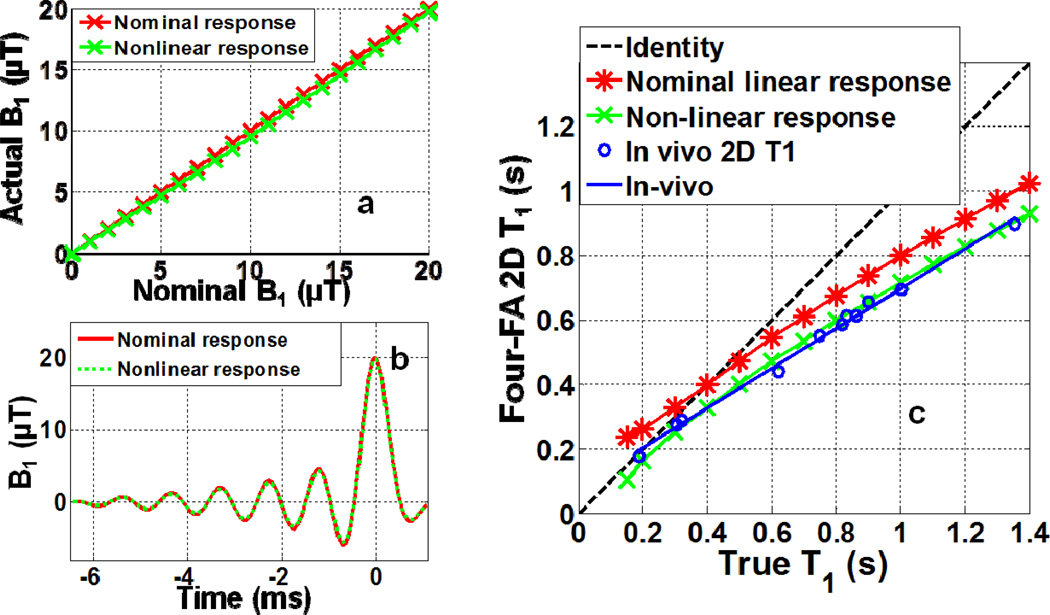
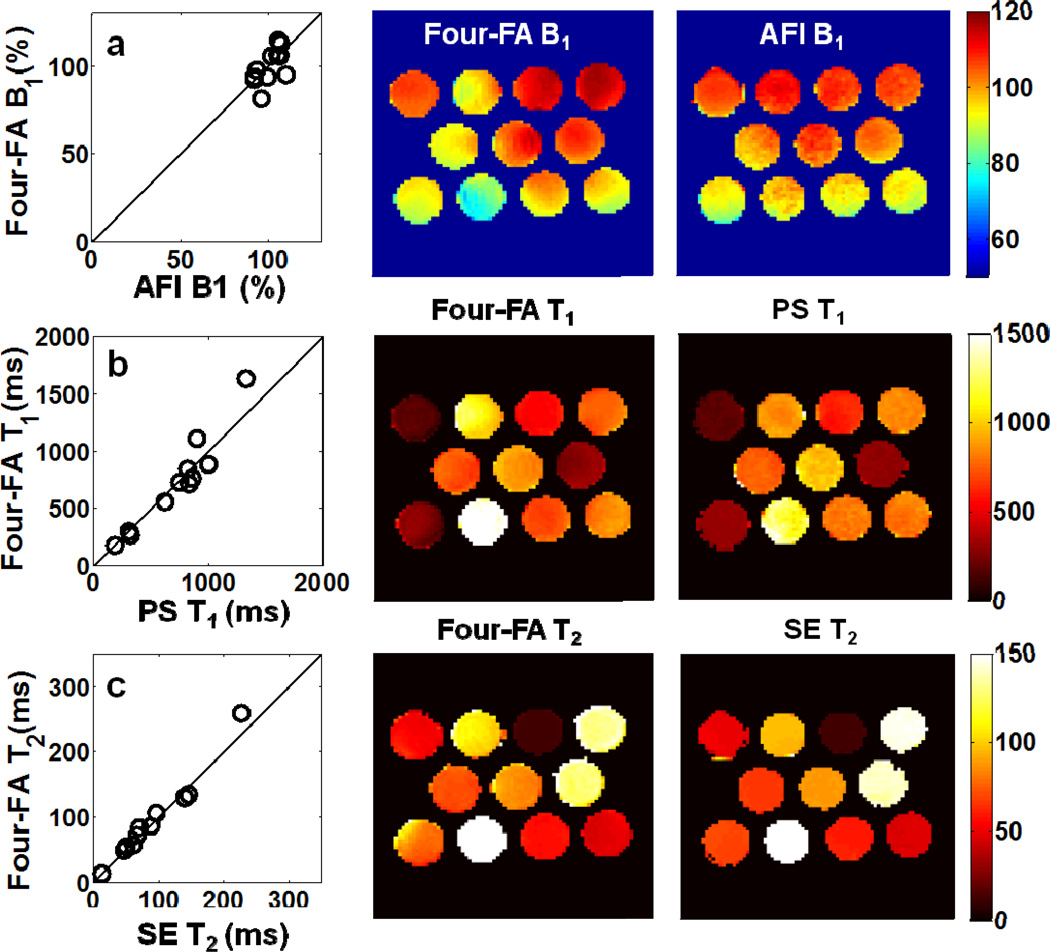
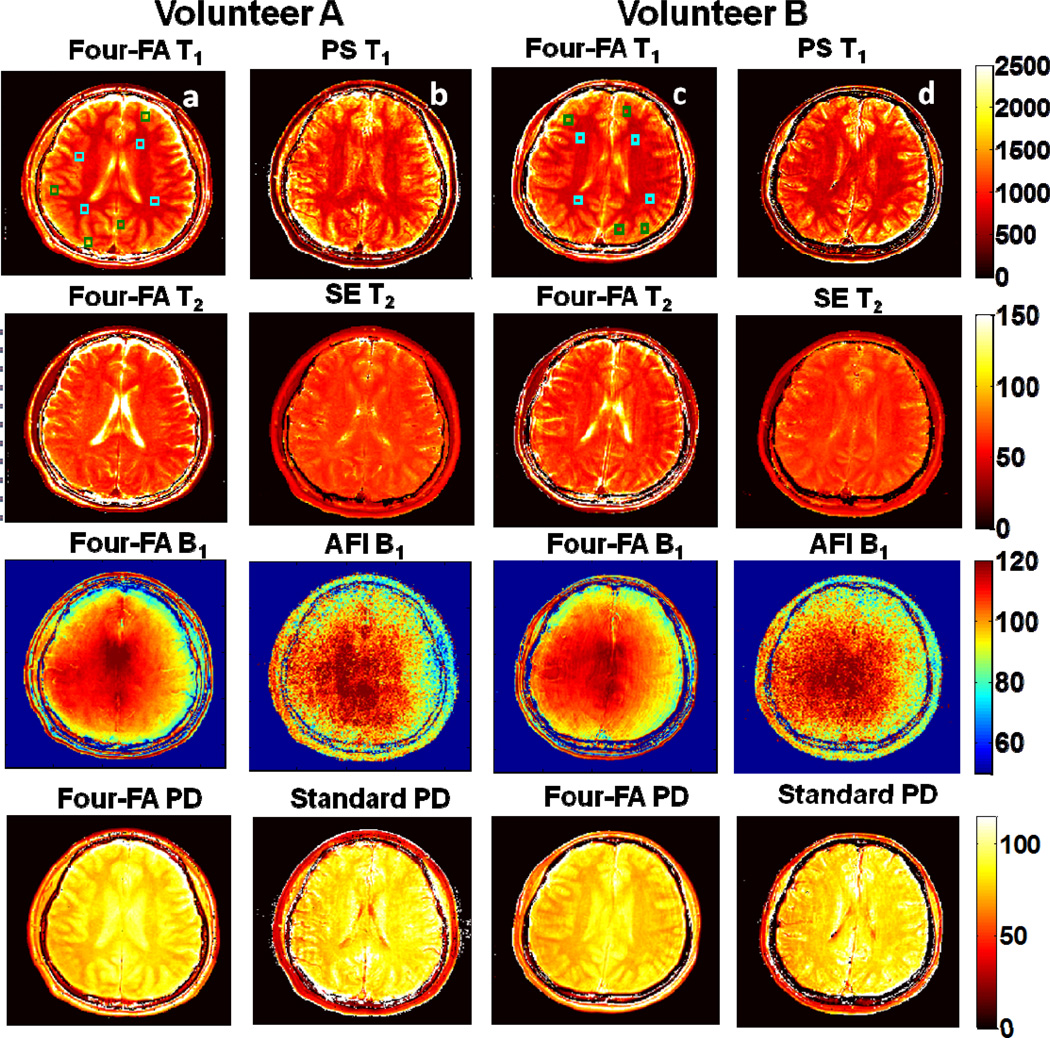
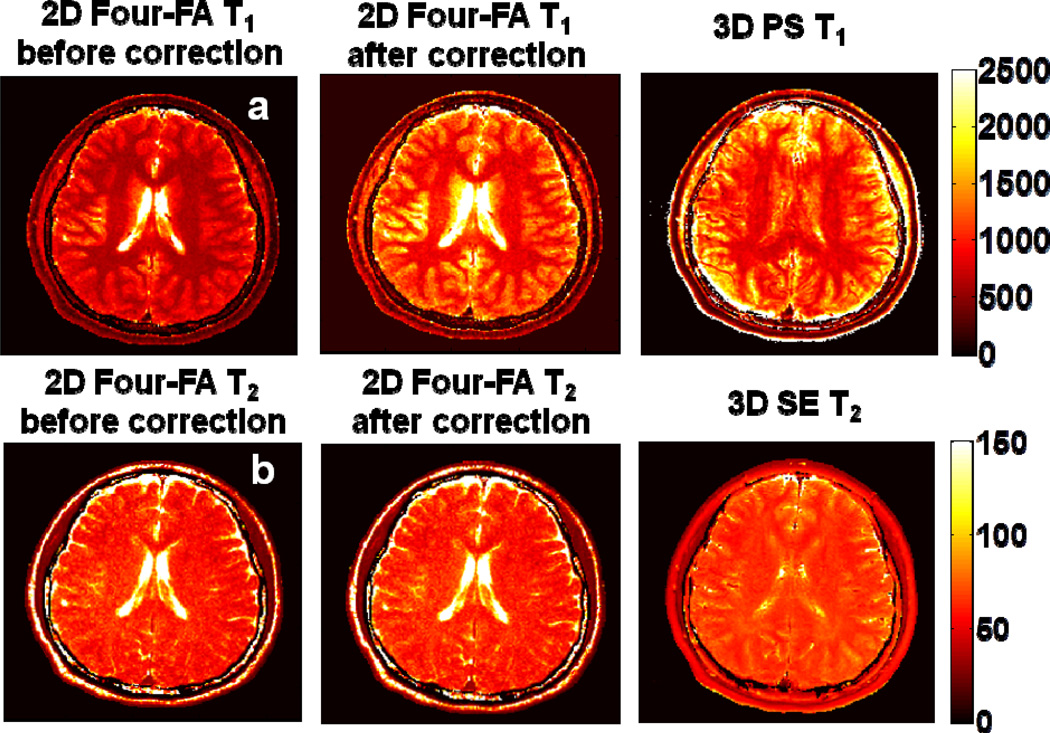
The spin lattice (T(1)) and spin-spin (T(2)) relaxation times, along with the proton density (PD) contain almost all of the information that (1)H MRI routinely uses in clinical diagnosis and research, but are seldom imaged directly. Here, three methods for directly imaging T(1), T(2), and PD with the least possible number of acquisitions - three, are presented. All methods utilize long 0° self-refocusing adiabatic pre-pulses instead of spin-echoes to encode the T(2) information prior to a conventional gradient-echo MRI sequence. T(1) information is encoded by varying the flip-angle (FA) in the 'Dual-τ Dual-FA' and 'Four-FA' methods, or the sequence repetition period, TR, in the 'Dual-τ Dual-TR' method. Inhomogeneity in the FA distribution and slice-selection profile are recognized as the main error sources for T(1) measurements. The former is remedied by integrating an extra FA-dependent acquisition into the 'Four-FA' method to provide self-corrected T(1), T(2), PD, and FA in just four acquisitions - again, the minimum possible. Slice profile errors - which manifest as differences between 2D and 3D T(1) measurements, can be addressed by Bloch equation analysis and experimental calibration. All three methods are validated in phantom studies, and the 'Dual-τ Dual-FA' and 'Four-FA' methods are validated in human brain studies using standard partial saturation and spin-echo methods for reference. The new methods offer a minimum-acquisition option for imaging single-component T(1), T(2), and PD. 'Four-FA' performs best overall in accuracy, with high efficiency per unit accuracy vs. existing methods when B(1)-inhomogeneity is appropriately addressed.

Keywords: B(1) correction; MRI; Measurement; Proton density; Spin–latice relaxation; Spin–spin relaxation.


Figures

Fig. 1
Fig. 1
(a–c) Monte Carlo simulations of the SD in T1(with T2 =80ms), and (d–f) T2 (with T1 =1s) with an SNR of 50, and 100 runs. Part (a) and (d) show results for the ‘Dual-τ Dual-FA’ method with TR=0.609s, τ3=2τ2 =20ms, and B1 =13.5uT. Part (b) and (e) show results for the ‘Dual-τ Dual-TR’ method with TR2 =2TR1 =1.06s, τ2 =2τ1=20ms, B1 =20uT. Part (c) and (f) are for the ‘Four-FA’ method with TR=0.6s, TR4 =1.032s, τ=20ms, B1 =20uT over a larger T2 range.
Fig 2
Fig 2
Color-coded ‘Dual-τ Dual-FA’ images of (a) PD, (b) T1, and (c) T2 in the three-tube bottle gel phantom. Part (d) shows an AFI B1 map of the phantom. Part (e) plots the ‘Dual-τ Dual-FA’ T vs. the standard PS T1 for each compartment. Part (f) plots the ‘Dual-τ Dual-FA’ T2 vs. SE T2 in the compartments (above 150ms, the ‘Dual-τ Dual-FA’ T2 is not accurate[14]). The black lines denote identity. The scales of PD is in pu, T1 and T2 maps are in ms, and the B1 map is % of the nominal FA.
Fig 3
Fig 3
Color coded ‘Dual-τ Dual-FA’ (a) PD, (b) T1 (b) and (c) T2 images from a healthy human brain. T1 and T2 values in the annotated squares in GM (green) and WM (blue) are compared with known values in the text. The scales are in pu (PD) and ms (T1 and T2).
Fig 4
Fig 4
Monte Carlo simulations used for selecting TR and FA: (a) the SD in the ‘Dual-τ Dual-TR T1 experiment as a function of TR; and the SD in the ‘Four-FA’ T1 experiment as a function of (b) θ1, (d), θ2, and (e) θ3, with each of the other two FAs set to the most favorable values (30°, 80°, 140°, respectively), and SNR=50. The horizontal blue line is the true (input) T1 value. Part (f) shows the SD in the ‘Four-FA’ T1 measurement as a function of θ1 and θ2, varied independently with a noise level=M0/100. The scale reflects the SD as a fraction of the true T1. (c) The normalized steady-state signal as a function of nominal FA for B1-field variations from 50–100% (q =0.5–1.0), TR=25ms and TR=600ms. B1 field differences can only be differentiated at long TR and high FA.
Fig. 5
Fig. 5
In vitro color-coded Dual-τ Dual-TR (a) PD, (b) T1 and (c) T2 from the same phantom as Fig.2. Parts (d) and (e) plots the mean T1 and T2 values for the four compartments compared to measured standard PS and SE values (the black line is the identity line).
Fig. 6
Fig. 6
(a) Waveforms of ‘spredrex’ (blue) and truncated ‘sinc’(grey) FA=80° pulses used in our ‘Four-FA MRI sequences. The ‘spredrex’ pulse is more than twice as long as the truncated sinc pulse. Parts (b–d) show the slice profiles for the spredrex and sinc pulses determined from the magnitude of the transverse magnetization for (b) 30°, (c) 80°, and (d) 140° pulses used in the ‘Four-FA studies. The dashed red line is an ideal 5mm slice pulse profile.
Fig 7
Fig 7
Effect of slice profile on T1. (a) Actual B1, or B1A, for a linear system response (red stars), and with (green crosses) a small second-order (B1A =0.004B1I2+0.91B1I) RF system response, as a function of input B1, denoted B1I. (b) Effect of the linear and second-order responses on the ‘Spredrex’ excitation waveform for a maximum B1 =20µT (FA=140°). (c) Bloch equation simulation of the ‘Four-FA’ T1 acquired with the 2D ‘Spredrex’ excitation pulse from (b), compared to the true T1 assuming linear (red stars) and non-linear (green crosses) RF system responses. Blue circles show the experimental results from the 11-tube phantom fitted to a straight line (R2=0.995; T12D =0.62T12D+81.3;blue line) that were used for calibration. Here, the 3D PS T1, denoted T13D , measurements are plotted as the ‘True T1’.
Fig. 8
Fig. 8
‘Four-FA’ results vs. reference values (column 1), and corresponding ‘Four-FA’ (column 2) and reference images (column 3) from the 11-tube phantom. Color scales are the same for each row (row a, B1 distribution, % nominal FA; row b, T1, ms; row c, T in ms).
Fig. 9
Fig. 9
In vivo 3D ‘Four-FA images for two healthy volunteers (A, column a; B, column c) compared with corresponding standard maps from the same subjects (columns b and d, respectively). The maps are depicted with the same scales at right. The T1 and T2 scales are in ms, the B1 scale is in % and PD is in pu. ‘Four-FA’ relaxation values in the annotated boxes are compared with PS T1 and SE T2 values in the text. The poorer SNR and CSF contrast in the standard T1and T2 maps is attributable to the TR settings used for these studies.
Fig. 10
Fig. 10
2D ‘Four-FA’ T1 (Row a) and T2 (Row b) before and after application of slice profile corrections, as compared to standard PS and SE measurements from the central slice of 3D data sets, which do not have the slice profile problem. GM and WM show good agreement with the standards. The data are from Volunteer A in Fig. 9, and the scales are in ms.

References

    1. Deoni SCL, Rutt BK, Peters TM. Rapid combined T1 and T2 mapping using gradient recalled acquisition in the steady state. Magnetic Resonance in Medicine. 2003;49:515–526. - PubMed
    1. Schmitt P, Griswold MA, Jakob PM, Kotas M, Gulani V, Flentje M, Haase A. Inversion recovery TrueFISP: Quantification of T1, T2, and spin density. Magnetic Resonance in Medicine. 2004;51:661–667. - PubMed
    1. Heule R, Ganter C, Bieri O. Triple echo steady-state (TESS) relaxometry. Magnetic Resonance in Medicine. 2013 n/a-n/a. - PubMed
    1. Bieri O, Scheffler K. On the origin of apparent low tissue signals in balanced SSFP. Magnetic Resonance in Medicine. 2006;56:1067–1074. - PubMed
    1. Tong CY, Prato FS. A novel fast T1-mapping method. Journal of Magnetic Resonance Imaging. 1994;4:701–708. - PubMed

Publication types