. 2014 May;11(5):552-4.
doi: 10.1038/nmeth.2921. Epub 2014 Apr 6.

Measuring similarity between dynamic ensembles of biomolecules

Affiliations

Measuring similarity between dynamic ensembles of biomolecules

Shan Yang et al. Nat Methods. 2014 May.

Abstract

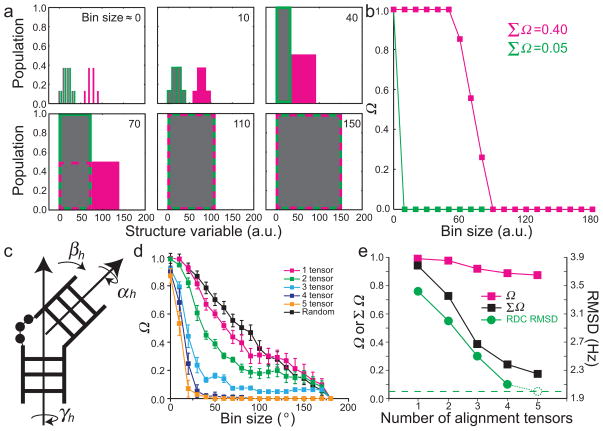
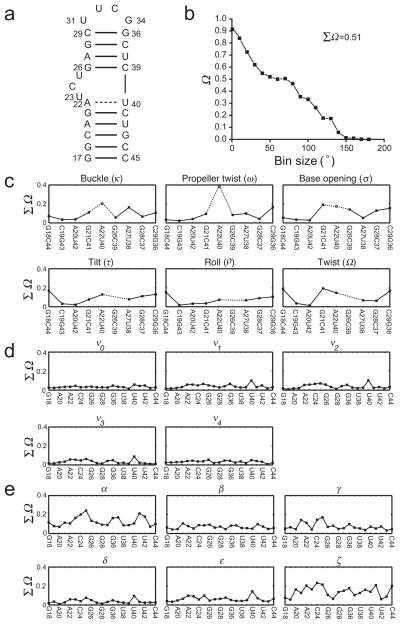
We present a simple and general approach termed REsemble for quantifying population overlap and structural similarity between ensembles. This approach captures improvements in the quality of ensembles determined using increasing input experimental data--improvements that go undetected when conventional methods for comparing ensembles are used--and reveals unexpected similarities between RNA ensembles determined using NMR and molecular dynamics simulations.


Conflict of interest statement

Competing financial interests

H.M.A. is an advisor to and holds an ownership interest in Nymirum, an RNA-based drug discovery company. The research reported in this article was performed by the University of Michigan and Duke University faculty, post-doctoral fellow and student and was funded by US National Institute of Health contract to H.M.A.

Figures

Figure 1
Figure 1. Measuring population overlap and structural similarity between ensembles
(a) Three discrete ensembles (gray, green, and magenta) described in terms of an arbitrary structural variable are shown as a function of increasing bin size used to build the histogram distribution. Dashed magenta and solid green boxes around the gray ensemble indicate the portion of magenta and green ensemble respectively that are binned together with the gray ensemble. (b) Plots of Ω as a function of increasing bin size comparing the gray vs. green (green line) and gray vs. magenta (magenta line) ensembles. (c) The relative orientation of two helices (or domains) is defined using three Euler angles (αh, βh, γh). Shown are two RNA helices linked by a trinucleotide bulge. (d) Ω versus bin size comparing the inter-helical angle distributions about a trinucleotide bulge linker between a target ensemble (N=5) and ensembles (N=5) that are selected from the pool randomly (black) or using increasing number of input RDC data sets in SAS selections (color-coded, see inset). The standard deviations of Ω at each bin size over the 50 repetitions of each prediction are shown as error bars (see Methods). (e) The value of Ω at bin size=5° (magenta squares) and ΣΩ (black squares) as a function of number of RDC data sets used in ensemble reconstruction. Also shown is the root-mean-square-deviation (RMSD) in leave-out cross validation in which a constructed ensemble is used to predict a common left out set of RDCs (green circles). The dashed circle represents the optimum RMSD when the left-out data set itself is included in the selection and the flat dashed line denotes the assigned 2 Hz RDC uncertainty.
Figure 2
Figure 2. Comparing MD-generated and NMR-RDC selected ensembles of HIV-1 TAR
(a) Secondary structure of HIV-1 TAR RNA. The highly flexible junction A22-U40 base pair is indicated using a dashed line. (b) Ω versus bin size plots comparing the inter-helical angle distribution in the MD and RDC-selected (N=20) ensembles. The binning is preformed in terms of single-axis rotation amplitudes (see Methods). (c–e) ΣΩ value comparing the distributions of (c) base-pair parameters, (d) sugar and (e) backbone torsion angles between the MD and the RDC selected ensemble. The intra-base-pair parameters for the flexible junction A22-U40 base-pair are shown using open symbols and dashed lines and inter-base-pair parameters are not shown for the junction G26-C39 base-pair because they are ill-defined due to presence of the bulge between G26-C39 and A22-U40.

References

    1. Jensen MR, et al. Structure. 2009;17:1169–1185. - PubMed
    1. Clore GM, Schwieters CD. Biochemistry. 2004;43:10678–10691. - PubMed
    1. Salmon L, Yang S, Al-Hashimi HM. Annu Rev Phys Chem. 2013;65:293–316. - PMC - PubMed
    1. Boehr DD, Nussinov R, Wright PE. Nat Chem Biol. 2009;5:789–796. - PMC - PubMed
    1. Wand AJ. Curr Opin Struct Biol. 2013;23:75–81. - PMC - PubMed

Publication types

LinkOut - more resources