. 2014 Jun;9(6):466-73.
doi: 10.1038/nnano.2014.54. Epub 2014 Apr 6.

Single-molecule spectroscopy of amino acids and peptides by recognition tunnelling

Affiliations

Single-molecule spectroscopy of amino acids and peptides by recognition tunnelling

Yanan Zhao et al. Nat Nanotechnol. 2014 Jun.

Abstract

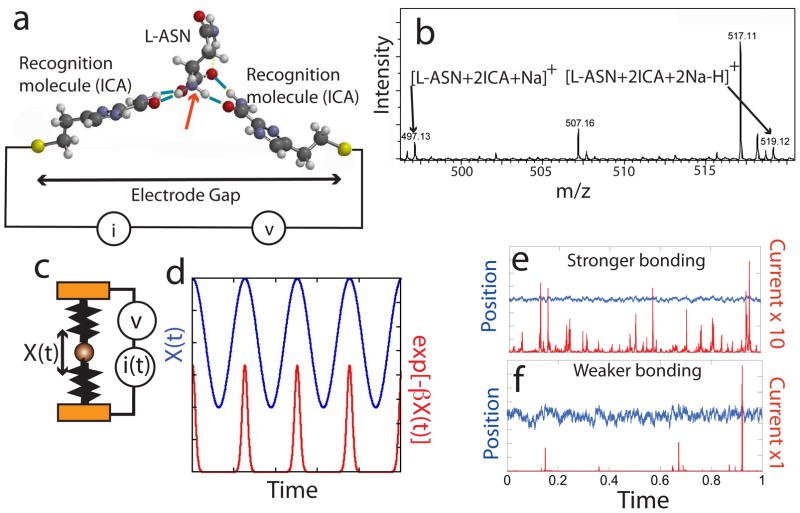
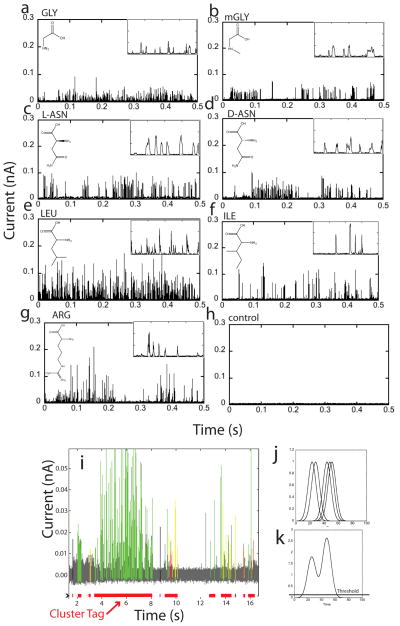
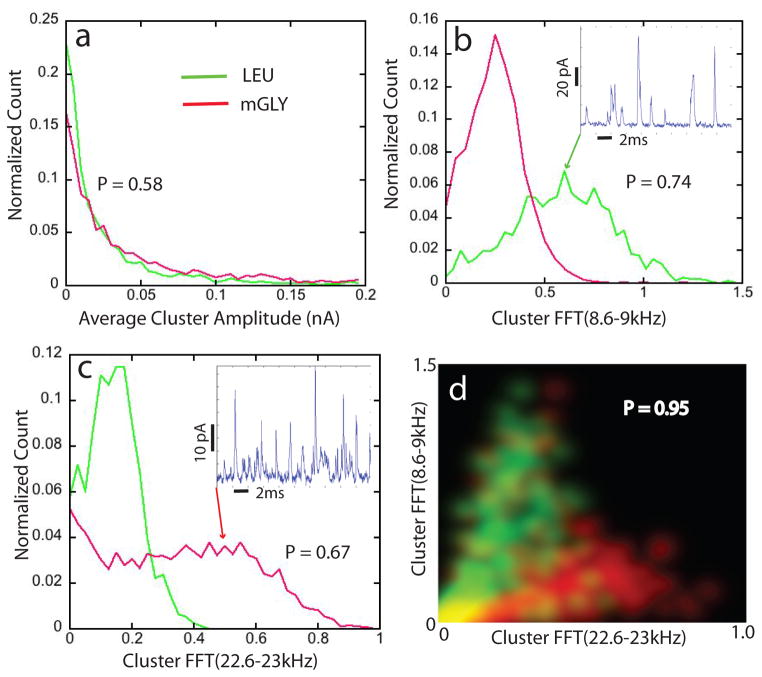
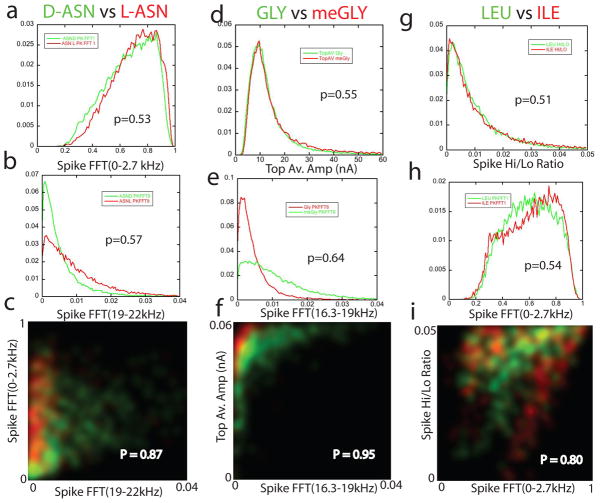
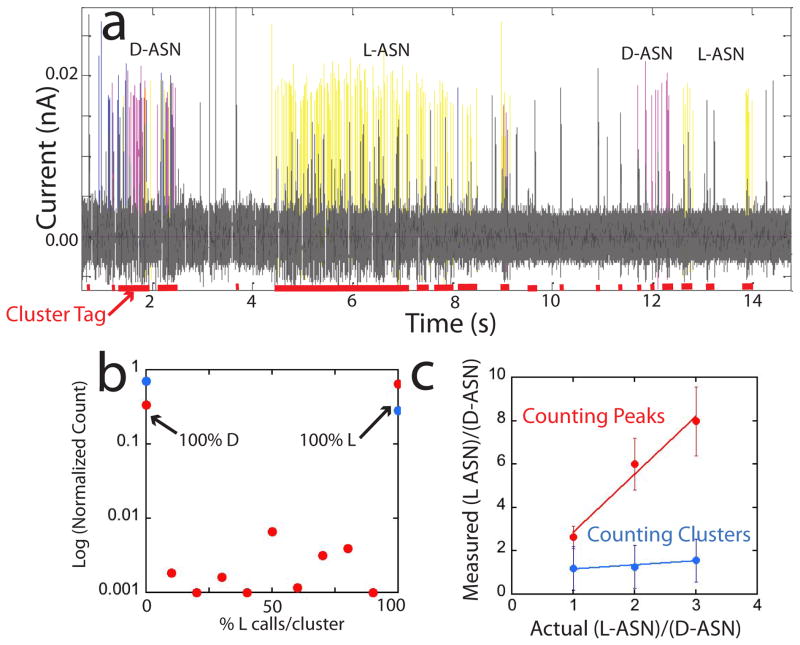
The human proteome has millions of protein variants due to alternative RNA splicing and post-translational modifications, and variants that are related to diseases are frequently present in minute concentrations. For DNA and RNA, low concentrations can be amplified using the polymerase chain reaction, but there is no such reaction for proteins. Therefore, the development of single-molecule protein sequencing is a critical step in the search for protein biomarkers. Here, we show that single amino acids can be identified by trapping the molecules between two electrodes that are coated with a layer of recognition molecules, then measuring the electron tunnelling current across the junction. A given molecule can bind in more than one way in the junction, and we therefore use a machine-learning algorithm to distinguish between the sets of electronic 'fingerprints' associated with each binding motif. With this recognition tunnelling technique, we are able to identify D and L enantiomers, a methylated amino acid, isobaric isomers and short peptides. The results suggest that direct electronic sequencing of single proteins could be possible by sequentially measuring the products of processive exopeptidase digestion, or by using a molecular motor to pull proteins through a tunnel junction integrated with a nanopore.


Conflict of interest statement

Competing Financial Interests

YZ, PZ and SL are named as inventors in patent applications. SL is cofounder of a company based on this technology.

Figures

Figure 1
Figure 1. Recognition tunneling (RT)
(a) Recognition molecules (1H-imidazole-2-carboxamide, ICA) are strongly attached to a pair of closely spaced electrodes, displacing contamination and forming a chemically well -defined surface. An analyte (here shown as L-ASN) is captured by non covalent interactions (blue bars show H-bonds) with the recognition molecules. The bonding pattern is specific to the analyte. The red arrow shows the orientation of the molecular dipole for L-ASN. This orientation is different when D-ASN is captured (Fig. S1). (b) ESIMS shows that stoichiometric adducts form between reader molecules here illustrated for 2:1 complexes of ICA and L-ASN. Data for other analytes are given in Tables S6 and S7. How RT signals are generated: (c) Picturing the analyte as amass (sphere) trapped by a pair of springs that represent the non-covalent bonds, the extent of analyte motion, X(t), depends on the strength of the springs. (d) A simple sinusoidal motion of the analyte (blue trace) produces a series of sharp current spikes (red trace) because of the exponential dependence of tunnel current on position. (e) and (f) are simulations for random thermal excitation of a strongly (e) and more weakly (f) bonded analyte, showing how the current fluctuations are much bigger when the bonding is weaker (red traces). The simulations are carried out as described in Huang et al.
Figure 2
Figure 2
Examples of RT signals from amino acids. GLY (a) and its N-methylated modification, sarcosine (mGLY) (b). Enantiomers L-ASN (c) and D-ASN (d). Isobaric isomers LEU (e) and ILE (f). (g) shows data for the charged amino acid, ARG. (h) is control data from buffer solution alone. The insets are expanded traces (current scale 150 pA, time scale 20 ms) displaying the complex peak shapes that are important features in the analysis of these data. (i) Signal trace for ARG, color-coded according to the peak assignments made by a machine learning algorithm (green = correct, red = wrong call, black = “water peak”, yellow = common to all amino acids). The red bars at the bottom mark signal clusters generated by a particular single-molecule binding event. Automatic cluster-identification was done by placing Gaussians of unit height and full-width of 4096 data points (1 data point = 20 us) at the location of each spike (j), summing them (k), and assigning a cluster to regions where this sum exceeds 0.05. This choice picks out obvious single molecule events well (cf. Fig. 5).
Figure 3
Figure 3
Signal features identify analytes: (a) Peak amplitudes are exponentially distributed so provide little discrimination. Assigning the larger spikes to mGLY (red curve) yields an accuracy (p=0.58) only slightly better than random (0.5). Particular Fourier components (Table S1) of the clusters (b and c) show more separation, producing 74% (b) and 67% (c) accuracies if called solely on the more probable value of the feature. The way in which these Fourier components reflect peak shapes in a cluster is illustrated by the signal traces inset in (b) and (c), each trace having the feature value pointed to. The high amplitude of high-frequency components of the mGLY signals (inset in c) is evident in the sharper spikes. Accuracy improves when multiple features are used together. (d) Shows a 2D plot of probability density as a function of the two FFT feature values. The color scale shows mGLY data points as red and LEU points as green. Calling all the spikes with pairs of feature values that fall in the green regions as LEU and all the spikes with pairs of features that fall in the red regions as mGLY produces a correct call 95% of the time. Only the yellow regions yield ambiguous calls.
Figure 4
Figure 4
Closely related pairs of analytes can be significantly separated (>80%) using just two signal features together. All data are for pure solutions of one analyte. Chiral enantiomers D-ASN and L-ASN (a,b,c), GLY and mGLY (d,e,f), and the isobaric isomers LEU and ILE (g,hi) are quite well separated in a 2D probability density maps (c, f and i) even when the distributions of any one signal feature are almost completely overlapped in 1D (a,d,g,b,e and h see Methods and Table S1 for a description of these features). The 2D maps plot probability densities for the analyte pairs (color coded as listed at the top) as a function of both the features that, by themselves, produce separations only a little above random (0.51 to 0.64). Probabilities of making a correct call based on the probability densities are marked on c, f and I, and calculated as described in the caption for Figure 3.
Figure 5
Figure 5
A mixture produces alternating cluster signals as different molecules diffuse into and out of the gap. (a) Signal trace obtained with a 1:1 mixture of L- and D- asparagine. The Support Vector Machine assignments are coded purple (D-ASN) and yellow (L-ASN) (black spikes are unassigned). Each cluster (red tags) contains only one type of signal, as shown statistically in (b). The red points are for 556 raw data clusters and the blue points are for 400 clusters that remain after filtering for common signals. After filtering (blue points), no mixed clusters survive, with all of the clusters being 100% L- or D-ASN signals. Quantification of the L/D ratio using SVM trained on pure samples is shown in (c). The measured ratio increases with actual ratio in the samples but the calibration depends on whether the number of signal spikes (red) or clusters (blue) is used, probably reflecting differential binding. Error bars are from repeated runs and repeated samplings.

References

    1. Huang S, et al. Identifying single bases in a DNA oligomer with electron tunneling. Nature Nanotechnol. 2010;5:868–873. - PMC - PubMed
    1. Uhlen M, Ponten F. Antibody-based Proteomics for Human Tissue Profiling. Molecular & Cellular Proteomics. 2005;4:384–393. - PubMed
    1. National Research Council (US) Committee on Intellectual Property Rights in Genomic and Protein Research and Innovation. Reaping the Benefits of Genomic and Proteomic Research: Intellectual Property Rights, Innovation, and Public Health. National Academies Press (US); 2006. - PubMed
    1. Archakov AI, Ivanov YD, Lisitsa AV, Zgoda VG. AFM fishing nanotechnology is the way to reverse the Avogadro number in proteomics. Proteomics. 2007;7:4–9. - PubMed
    1. Chang S, et al. Electronic Signature of all four DNA Nucleosides in a Tunneling Gap. Nano Letts. 2010;10:1070–1075. - PMC - PubMed

Publication types