

The secretory deficit in islets from db/db mice is mainly due to a loss of responding beta cells
- PMID: 24705605
- PMCID: PMC4052007
- DOI: 10.1007/s00125-014-3226-8
The secretory deficit in islets from db/db mice is mainly due to a loss of responding beta cells
Abstract
Aims/hypothesis: We used the db/db mouse to determine the nature of the secretory defect in intact islets.
Methods: Glucose tolerance was compared in db/db and wild-type (WT) mice. Isolated islets were used: to measure insulin secretion and calcium in a two-photon assay of single-insulin-granule fusion; and for immunofluorescence of soluble N-ethylmaleimide-sensitive factor attachment proteins (SNAREs).
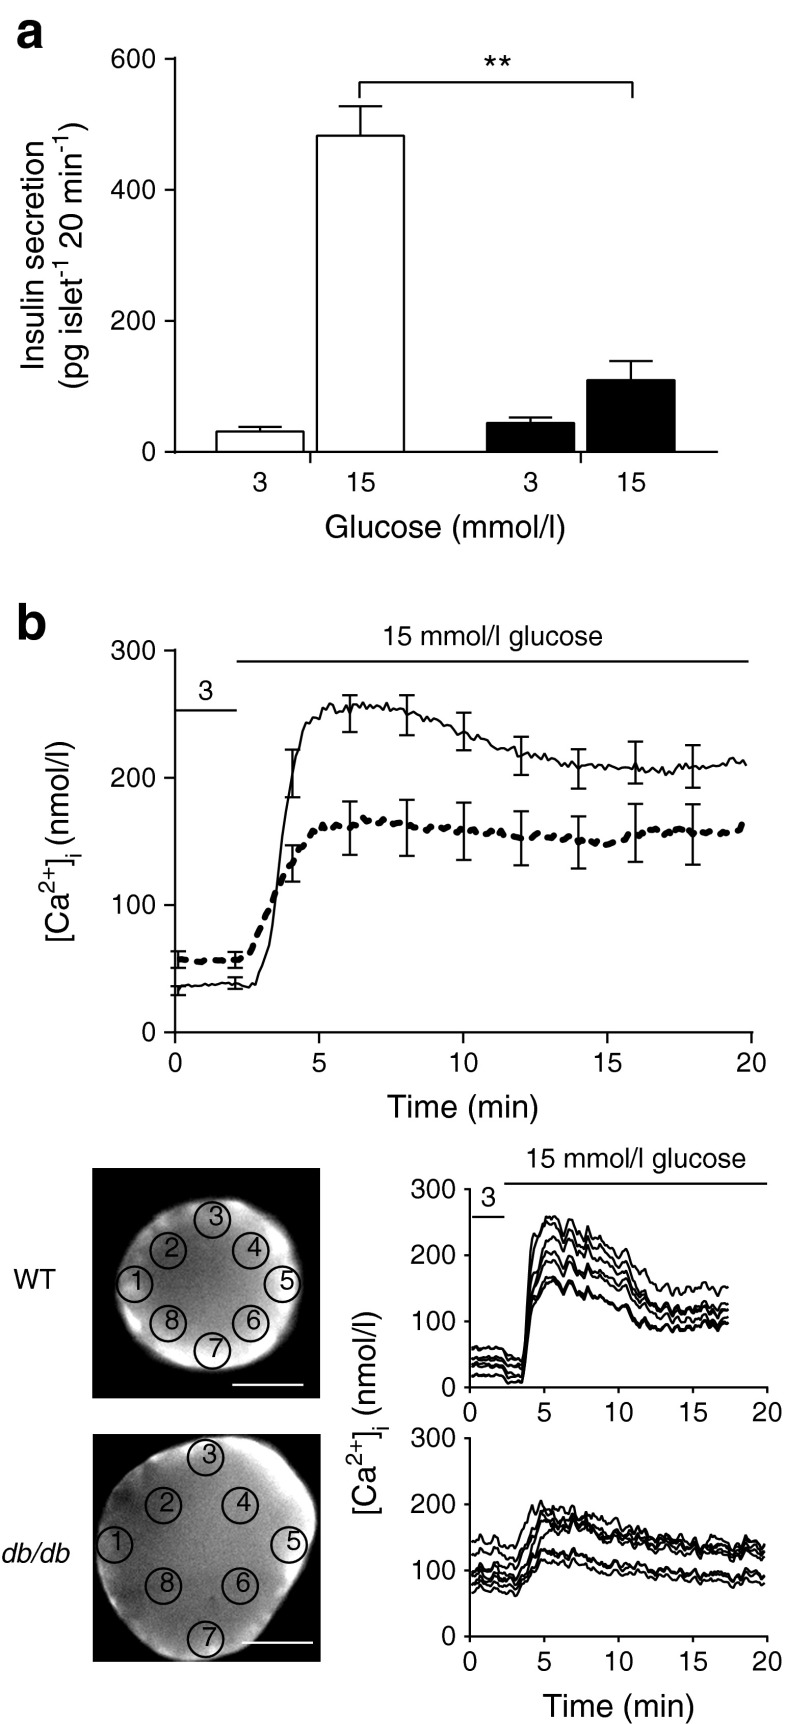
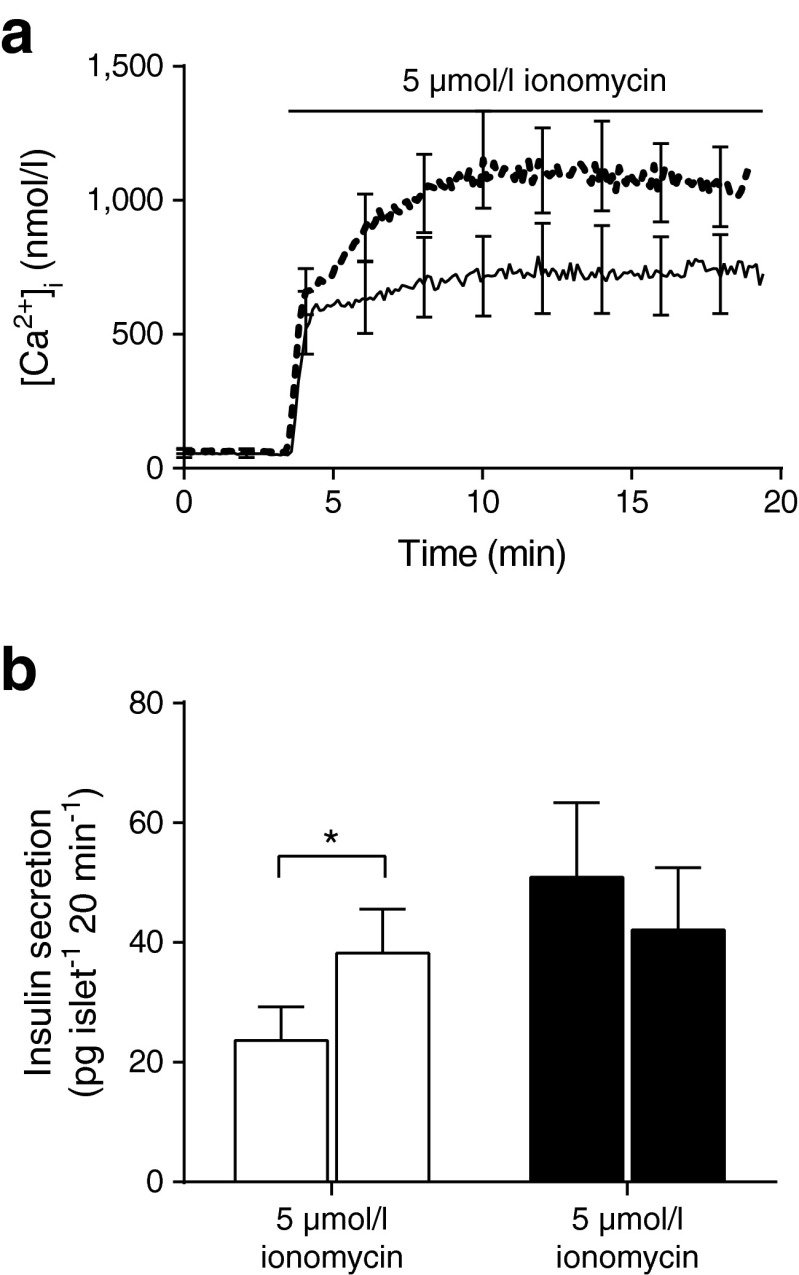
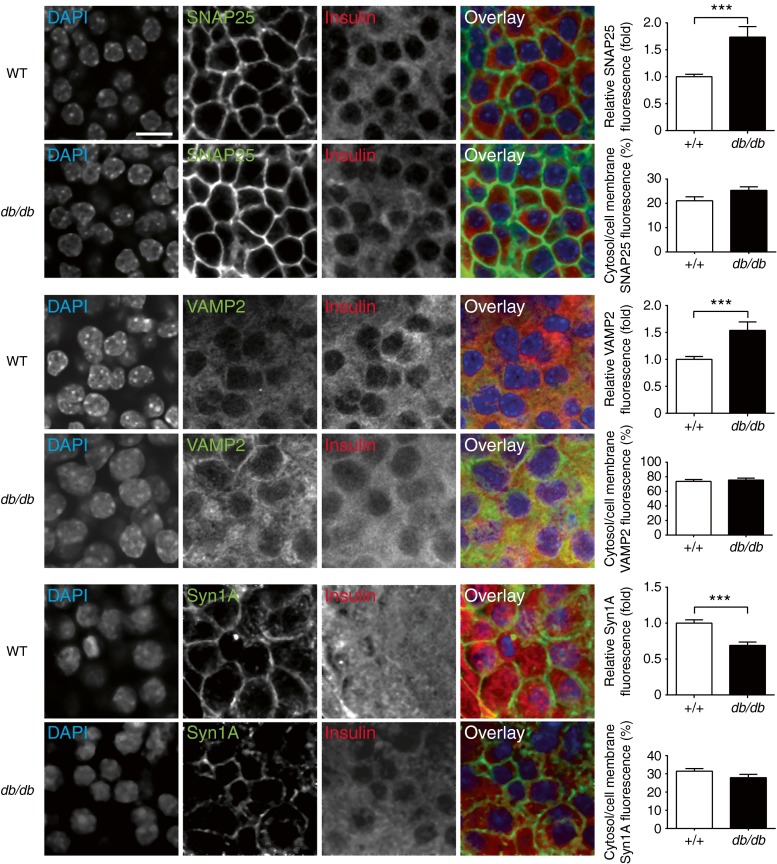
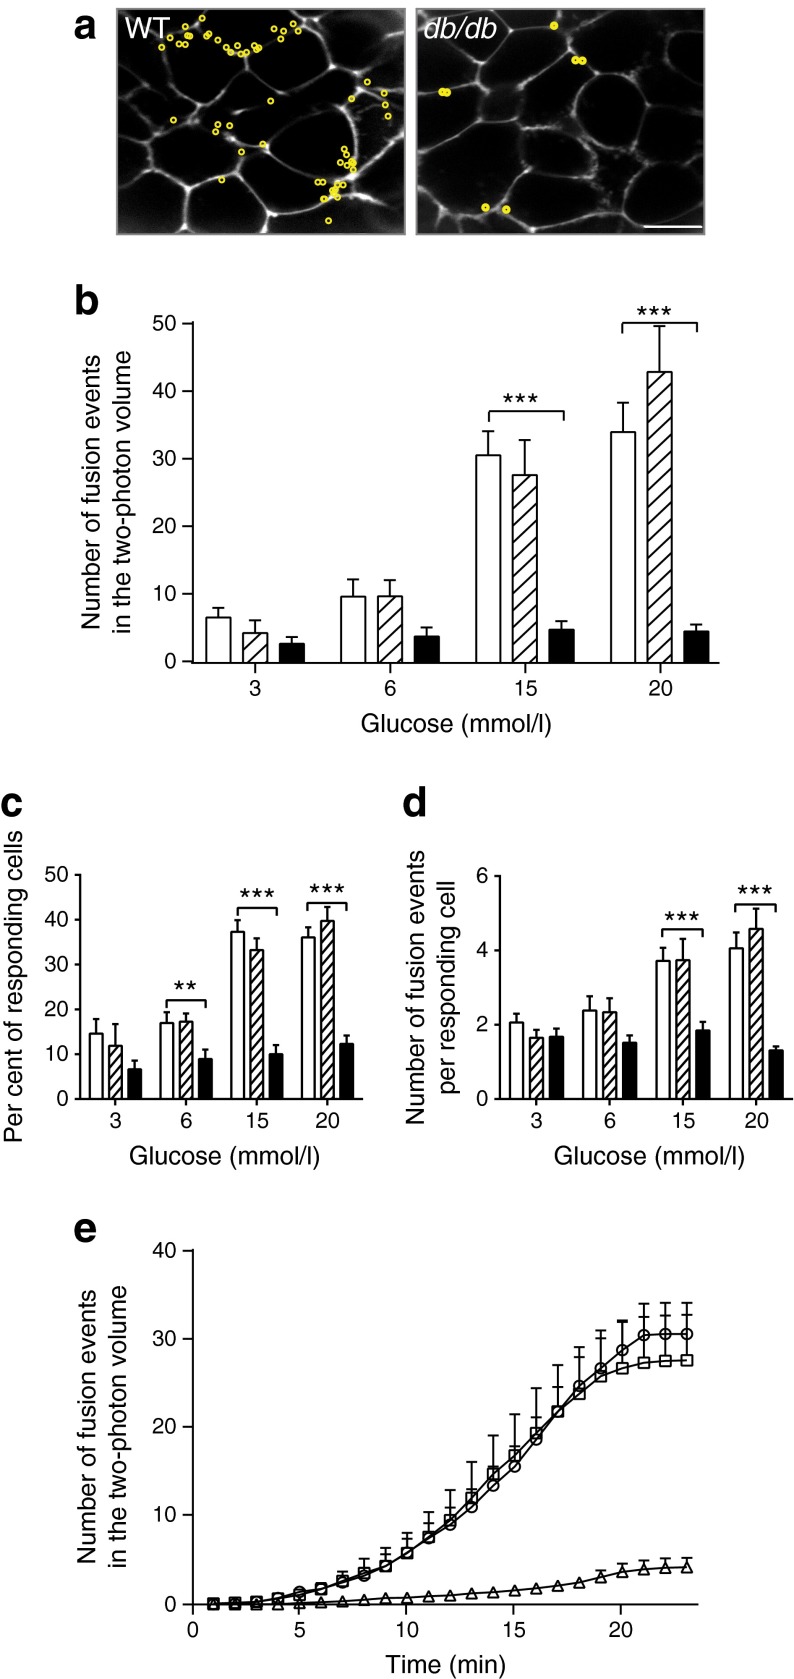
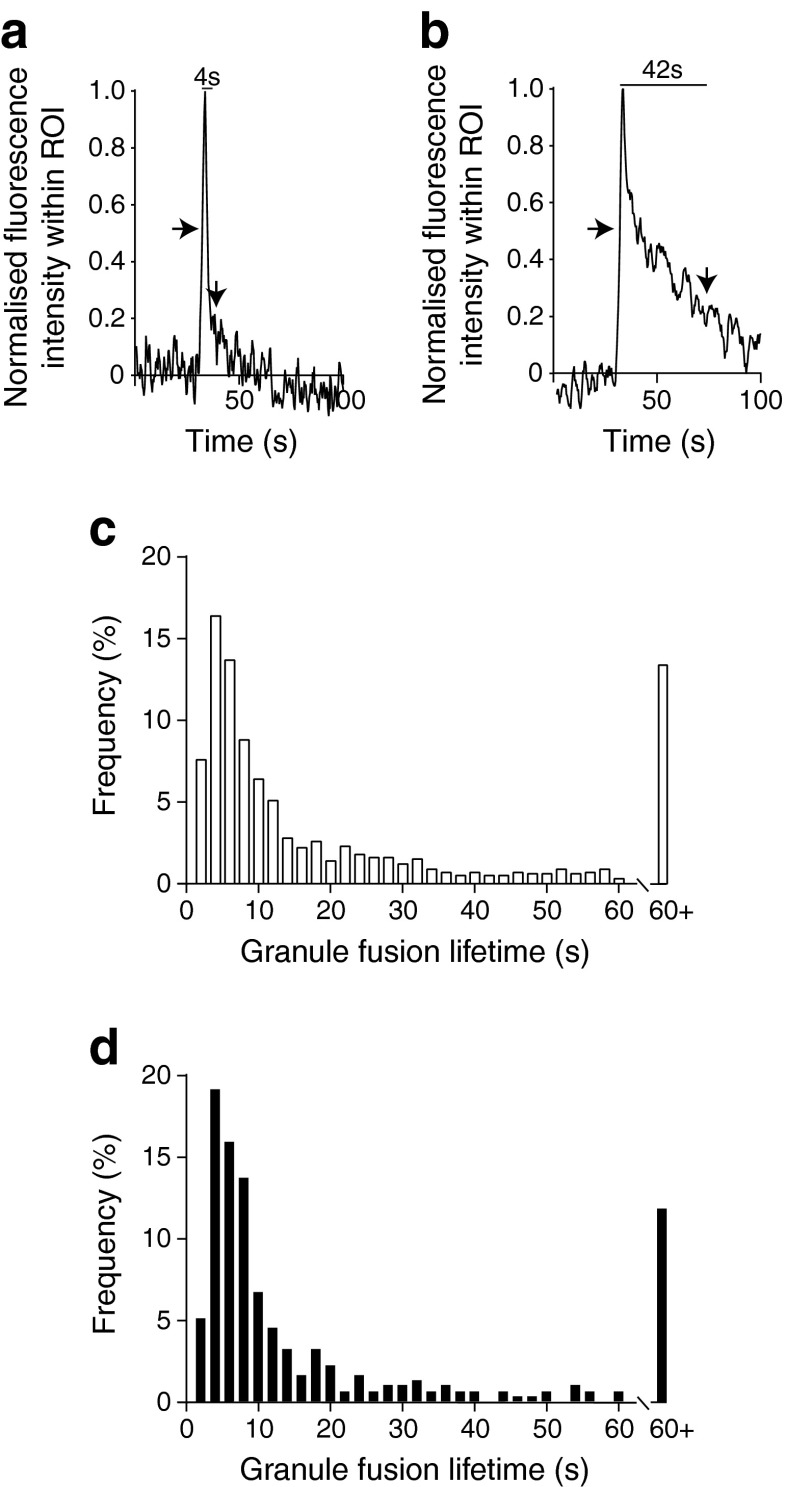
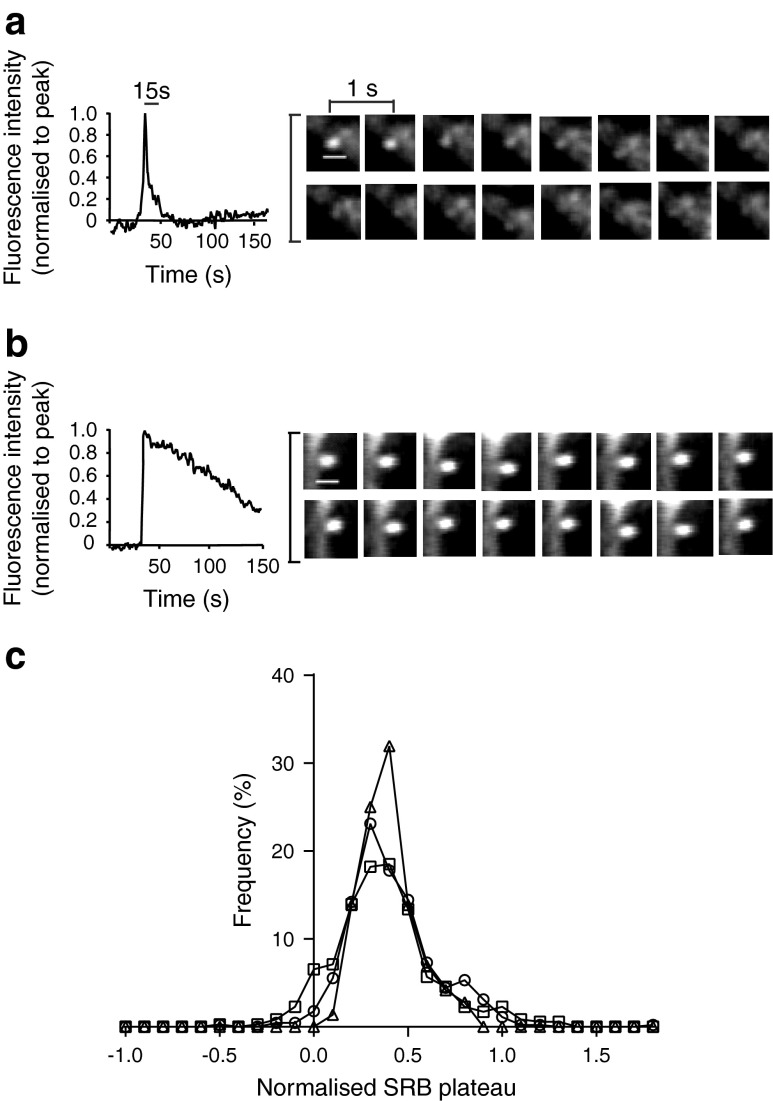
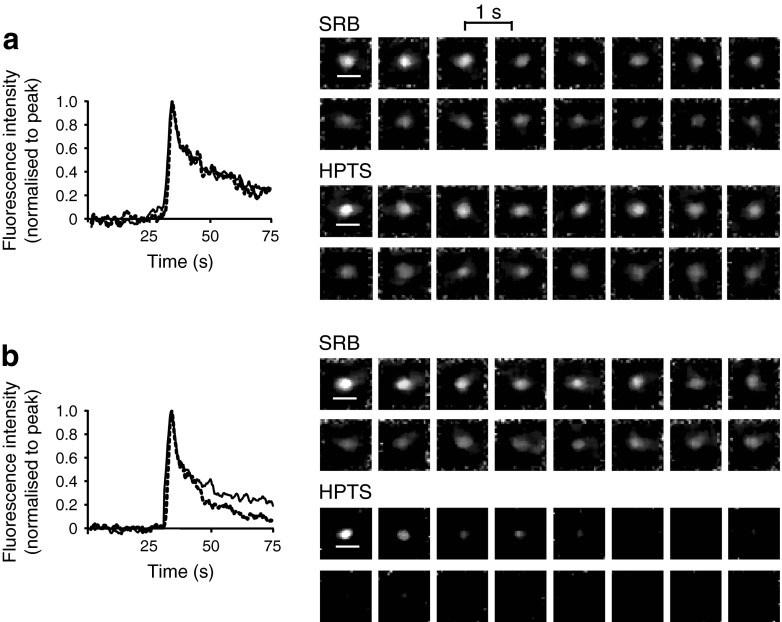
Results: The 13-18-week-old db/db mice showed a diabetic phenotype. Isolated db/db islets showed a 77% reduction in insulin secretion induced by 15 mmol/l glucose and reductions in the amplitude and rise-time of the calcium response to glucose. Ionomycin-induced insulin secretion in WT but not db/db islets. Immunofluorescence showed an increase in the levels of the SNAREs synaptosomal-associated protein 25 (SNAP25) and vesicle-associated membrane protein 2 (VAMP2) in db/db islets, but reduced syntaxin-1A. Therefore, db/db islets have both a compromised calcium response to glucose and a compromised secretory response to calcium. Two-photon microscopy of isolated islets determined the number and distribution of insulin granule exocytic events. Compared with WT, db/db islets showed far fewer exocytic events (an 83% decline at 15 mmol/l glucose). This decline was due to a 73% loss of responding cells and, in the remaining responsive cells, a 50% loss of exocytic responses per cell. An assay measuring granule re-acidification showed evidence for more recaptured granules in db/db islets compared with WT.
Conclusions/interpretation: We showed that db/db islets had a reduced calcium response to glucose and a reduction in syntaxin-1A. Within the db/db islets, changes were manifest as both a reduction in responding cells and a reduction in fusing insulin granules per cell.
Figures
Similar articles
-
Glucose-dependent changes in SNARE protein levels in pancreatic β-cells.Endocrinology. 2011 Apr;152(4):1290-9. doi: 10.1210/en.2010-0898. Epub 2011 Feb 1. Endocrinology. 2011. PMID: 21285315
-
Decreased expression of t-SNARE, syntaxin 1, and SNAP-25 in pancreatic beta-cells is involved in impaired insulin secretion from diabetic GK rat islets: restoration of decreased t-SNARE proteins improves impaired insulin secretion.Diabetes. 1999 Dec;48(12):2367-73. doi: 10.2337/diabetes.48.12.2367. Diabetes. 1999. PMID: 10580425
-
Metallothionein 1 negatively regulates glucose-stimulated insulin secretion and is differentially expressed in conditions of beta cell compensation and failure in mice and humans.Diabetologia. 2019 Dec;62(12):2273-2286. doi: 10.1007/s00125-019-05008-3. Epub 2019 Oct 17. Diabetologia. 2019. PMID: 31624901
-
Recent Insights into Beta-cell Exocytosis in Type 2 Diabetes.J Mol Biol. 2020 Mar 6;432(5):1310-1325. doi: 10.1016/j.jmb.2019.12.012. Epub 2019 Dec 19. J Mol Biol. 2020. PMID: 31863749 Free PMC article. Review.
-
Signal transduction in pancreatic beta-cells: regulation of insulin secretion by information flow in the phospholipase C/protein kinase C pathway.Front Biosci. 1997 Mar 15;2:d160-72. doi: 10.2741/a180. Front Biosci. 1997. PMID: 9159224 Review.
Cited by
-
Insulin secretion from beta cells within intact islets: location matters.Clin Exp Pharmacol Physiol. 2015 Apr;42(4):406-14. doi: 10.1111/1440-1681.12368. Clin Exp Pharmacol Physiol. 2015. PMID: 25676261 Free PMC article. Review.
-
Synaptotagmin 4 Regulates Pancreatic β Cell Maturation by Modulating the Ca2+ Sensitivity of Insulin Secretion Vesicles.Dev Cell. 2018 May 7;45(3):347-361.e5. doi: 10.1016/j.devcel.2018.03.013. Epub 2018 Apr 12. Dev Cell. 2018. PMID: 29656931 Free PMC article.
-
Angular Approach Scanning Ion Conductance Microscopy.Biophys J. 2016 May 24;110(10):2252-65. doi: 10.1016/j.bpj.2016.04.017. Biophys J. 2016. PMID: 27224490 Free PMC article.
-
pH-Dependence of Glucose-Dependent Activity of Beta Cell Networks in Acute Mouse Pancreatic Tissue Slice.Front Endocrinol (Lausanne). 2022 Jun 28;13:916688. doi: 10.3389/fendo.2022.916688. eCollection 2022. Front Endocrinol (Lausanne). 2022. PMID: 35837307 Free PMC article.
-
Long-term c-Kit overexpression in beta cells compromises their function in ageing mice.Diabetologia. 2019 Aug;62(8):1430-1444. doi: 10.1007/s00125-019-4890-5. Epub 2019 Jun 1. Diabetologia. 2019. PMID: 31154478
References
-
- Berglund O, Frankel BJ, Hellman B. Development of insulin secretory defect in genetically diabetic (db/db) mouse. Acta Endocrinol. 1978;87:543–551. - PubMed
Publication types
MeSH terms
Substances
LinkOut - more resources
Full Text Sources
Other Literature Sources
Medical
Molecular Biology Databases
Miscellaneous
