. 2014 Apr 4;9(4):e93864.
doi: 10.1371/journal.pone.0093864. eCollection 2014.

Parathyroid hormone administration improves bone marrow microenvironment and partially rescues haematopoietic defects in Bmi1-null mice

Affiliations

Parathyroid hormone administration improves bone marrow microenvironment and partially rescues haematopoietic defects in Bmi1-null mice

Ruinan Lu et al. PLoS One. .

Abstract

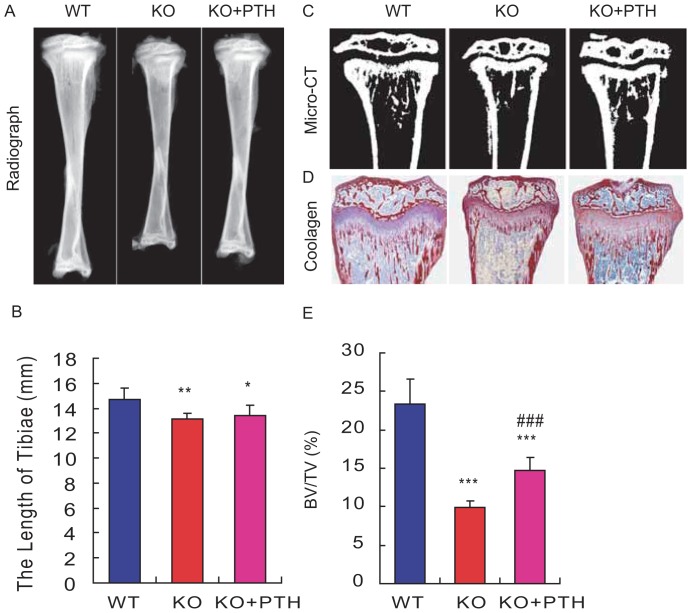
The epigenetic regulator Bmi1 is key in haematopoietic stem cells, and its inactivation leads to defects in haematopoiesis. Parathyroid hormone (PTH), an important modulator of bone homeostasis, also regulates haematopoiesis, so we asked whether PTH administration improves bone marrow microenvironment and rescues the haematopoietic defects in Bmi1-null mice. The mice were treated with PTH1-34 (containing the first 34 residues of mature PTH), an anabolic drug currently used for treating osteoporosis, and compared with the vehicle-treated Bmi1-/- and wild-type littermates in terms of skeletal and haematopoietic phenotypes. We found that the administration significantly increased all parameters related to osteoblastic bone formation and significantly reduced the adipocyte number and PPARγ expression. The bone marrow cellularity, numbers of haematopoietic progenitors and stem cells in the femur, and numbers of lymphocytes and other white blood cells in the peripheral blood all increased significantly when compared to vehicle-treated Bmi1-/- mice. Moreover, the number of Jagged1-positive cells and percentage of Notch intracellular domain-positive bone marrow cells and protein expression levels of Jagged1 and NICD in bone tissue were also increased in Bmi1-/- mice upon PTH1-34 administration,whereas the up-regulation of PTH on both Notch1 and Jagged1 gene expression was blocked by the Notch inhibitor DAPT administration. These results thus indicate that PTH administration activates the notch pathway and partially rescues haematopoietic defects in Bmi1-null mice, further suggesting that haematopoietic defects in the animals are not only a result of reduced self-renewal of haematopoietic stem cells but also due to impaired bone marrow microenvironment.


Conflict of interest statement

Competing Interests: The authors have declared that no competing interests exist.

Figures

Figure 1
Figure 1. Effect of PTH1-34 on the length of long bones and trabecular bone volume in Bmi-1-/- mice.
Representative radiographs, (B) quantitation of the length of tibiae, (C) 3-dimensional reconstructed longitudinal sections of micro-CT scanning images and (D) micrographs of paraffin sections of the tibiae stained with Siries Red for total collagen from 4-week-old vehicle-treated wild-type (WT) and Bmi-1-/- mice (KO) and PTH1-34-treated Bmi-1-/- mice (KO+PTH), magnification, ×50. (E) Quantitation of trabecular bone volume relative to tissue volume (BV/TV, %) in metaphyseal regions. For each genotype, n = 6; *: p<0.05, **: p<0.01, ***: p<0.001, compared to vehicle-treated WT mice; ###: p<0.001 compared to vehicle-treated Bmi-1-/- mice.
Figure 2
Figure 2. Effect of PTH1-34 on osteoblastic bone formation in Bmi-1-/- mice.
Representative micrographs of paraffin-embedded sections for tibial metaphyseal regions from 4-week old vehicle-treated wild-type (WT) and Bmi-1-/- mice (KO) and PTH1-34 treated Bmi-1-/- mice (KO+PTH) stained (A) histologically with hematoxylin & eosin (HE, ×400), (C) histochemically for alkaline phosphatase (ALP, ×200), immunohistochemically for (E) type I collagen (ColI, ×200), (G) osteopontin (OPN, ×200), (I) osterix (x400) and (K) PTHR (x400). (B) Osteoblast counts (#/mm2), (D) ALP-positive areas, (F) type I collagen- or (H) OPN- or (J) osterix- or (L) PTHR-immunopositive areas were measured by computer-assisted image analysis. For each genotype, N = 6; *: p<0.05, **: p<0.01, ***: p<0.001, compared to vehicle-treated WT mice; #: p<0.05, ##: p<0.01, ###: p<0.001 compared to vehicle-treated Bmi-1-/- mice.
Figure 3
Figure 3. Effect of PTH1-34 on expression of markers for osteoblastic bone formation in Bmi-1-/- mice.
(A–B) Real-time RT–PCR was performed on humerus extracts from 4-week-old vehicle-treated wild-type (WT) and Bmi-1-/- mice (KO) and PTH1-34 treated Bmi-1-/- mice (KO+PTH) for determining the expression of (A) alkaline phosphatase (ALP) and (B) osteocalcin. The expression is calculated as a ratio to the GAPDH mRNA level and shown relative to the levels in vehicle-treated WT mice. (C) Western blots of femur extracts from 4-week-old vehicle-treated WT and Bmi-1-/- mice and PTH1-34-treated Bmi-1-/- mice for expression of Runx2, PTHR and IGF-1. β-actin was used as loading control for Western blots. (D-F) Runx2, PTHR and IGF-1 protein levels relative to the β-actin level were assessed by densitometric analysis and presented relative to the levels in vehicle-treated WT mice. For each genotype, n = 6; *: p<0.05, **: p<0.01, ***: p<0.001, compared to vehicle-treated WT mice; #: p<0.05, ##: p<0.01, ###: p<0.001 compared to vehicle-treated Bmi-1-/- mice.
Figure 4
Figure 4. Effect of PTH1-34 on the bone marrow cellularity in Bmi-1-/- mice.
(A) Representative micrographs of paraffin-embedded sections of tibial diaphyseal regions from 4-week-old vehicle-treated wild-type (WT) and Bmi-1-/- mice (KO) and PTH1-34 treated Bmi-1-/- mice (KO+PTH) stained with hematoxylin and eosin (HE, ×400). (B) The one marrow cell number and (C) adipocyte number relative to tissue area were measured by computer-assisted image analysis. (D) Western blots of femur extracts from 4-week-old vehicle-treated WT and Bmi-1-/- mice and PTH1-34-treated Bmi-1-/- mice for determination of PPARγ expression. β-actin was used as the loading control. (E) The PPARγ level relative to the β-actin level was assessed by densitometric analysis and shown relative to the levels in the vehicle-treated WT mice. (F) Representative graphs of flow cytometry analysis for hematopoietic stem cells (HSCs) and hematopoietic progenitor cells (HPCs) in the bone marrows from 4-week-old vehicle-treated wild-type (WT) and Bmi-1-/- mice (KO) and PTH1-34- treated Bmi-1-/- mice (KO+PTH). (G-H) Fractions of Sca-1+c-kit+Lin HSCs and Sca-1+c-kit+Lin+ HPCs in the bone marrows. (I–J) The numbers of Sca-1+c-kit+Lin- HSCs and Sca-1+c-kit+Lin+ HPCs in each femur were assessed and presented relative to the levels in the vehicle-treated WT mice. For each genotype, n = 6; *: p<0.05, **: p<0.01, ***: p<0.001, compared to vehicle-treated WT mice; #: p<0.05, ##: p<0.01, ###: p<0.001 compared to vehicle-treated Bmi-1-/- mice.
Figure 5
Figure 5. Effect of PTH1-34 on the peripheral blood cellularity in Bmi-1-/- mice.
The peripheral blood from 4-week-old vehicle-treated wild-type (WT) and Bmi-1-/- mice (KO) and PTH1-34 treated Bmi-1-/- mice (KO+PTH) were analyzed by a hematological analyzer, to determine the number of white blood cells (A), lymphocytes (B), granulocytes (C), red blood cells (D), platelets (E) and the fraction of lymphocytes (F). For each genotype, n = 6; *: p<0.05, ***: p<0.001, compared to vehicle-treated WT mice; ##: p<0.01, ###: p<0.001 compared to vehicle-treated Bmi-1-/- mice.
Figure 6
Figure 6. Effect of PTH1-34 on Notch signal pathway-related molecules in Bmi-1-/- mice.
(A–B) Representative micrographs of paraffin-embedded sections of tibiae from 4-week-old vehicle-treated wild-type (WT) and Bmi-1-/- mice (KO) and PTH1-34- treated Bmi-1-/- mice (KO+PTH) stained immunohistochemically for the Notch ligand Jagged1 (A) and Notch intracellular domain (NICD, B), magnification, ×400. (C) The number of Jagged1-positive cells relative to bone surface (#/mm2) and (D) the percentage of NICD-positive bone marrow cells were measured by computer-assisted image analysis. (E) Western blots were performed on the long bone extracts for expression of jagged1and NICD. β-actin was used as loading control for Western blots. (F) jagged1 and (G) NICD protein levels relative to the β-actin level were assessed by densitometric analysis and presented relative to the levels in vehicle-treated WT mice. (H) Real-time RT–PCR was performed on long bone extracts from vehicle-treated wild-type (WT) and Bmi-1-/- mice (KO), PTH-treated Bmi-1-/- mice (KO+PTH) and PTH and DAPT-treated Bmi-1-/- mice (KO+PTH+PAPT) for determining the expression of Nortch1 and jagged1. The expression is calculated as a ratio to the GAPDH mRNA level and shown relative to the levels in vehicle-treated WT mice. For each genotype, n = 6; *: p<0.05, **: p<0.01, compared to vehicle-treated WT mice; #: p<0.05 compared to vehicle-treated Bmi-1-/- mice.

References

    1. Trumpp A, Essers M, Wilson A (2010) Awakening dormant haematopoietic stem cells. Nat Rev Immunol 10: 201–209. - PubMed
    1. Jones DL, Wagers AJ (2008) No place like home: anatomy and function of the stem cell niche. Nat Rev Mol Cell Biol 9: 11–21. - PubMed
    1. Lo Celso C, Scadden DT (2011) The haematopoietic stem cell niche at a glance. J Cell Sci 124: 3529–3535. - PMC - PubMed
    1. Frenette PS, Pinho S, Lucas D, Scheiermann C (2013) Mesenchymal stem cell: keystone of the hematopoietic stem cell niche and a stepping-stone for regenerative medicine. Annu Rev Immunol 31: 285–316. - PubMed
    1. Calvi LM, Adams GB, Weibrecht KW, Weber JM, Olson DP, et al. (2003) Osteoblastic cells regulate the haematopoietic stem cell niche. Nature 425: 841–846. - PubMed

Publication types

MeSH terms

LinkOut - more resources