

Identification of small ORFs in vertebrates using ribosome footprinting and evolutionary conservation
- PMID: 24705786
- PMCID: PMC4193932
- DOI: 10.1002/embj.201488411
Identification of small ORFs in vertebrates using ribosome footprinting and evolutionary conservation
Abstract
Identification of the coding elements in the genome is a fundamental step to understanding the building blocks of living systems. Short peptides (< 100 aa) have emerged as important regulators of development and physiology, but their identification has been limited by their size. We have leveraged the periodicity of ribosome movement on the mRNA to define actively translated ORFs by ribosome footprinting. This approach identifies several hundred translated small ORFs in zebrafish and human. Computational prediction of small ORFs from codon conservation patterns corroborates and extends these findings and identifies conserved sequences in zebrafish and human, suggesting functional peptide products (micropeptides). These results identify micropeptide-encoding genes in vertebrates, providing an entry point to define their function in vivo.
Figures
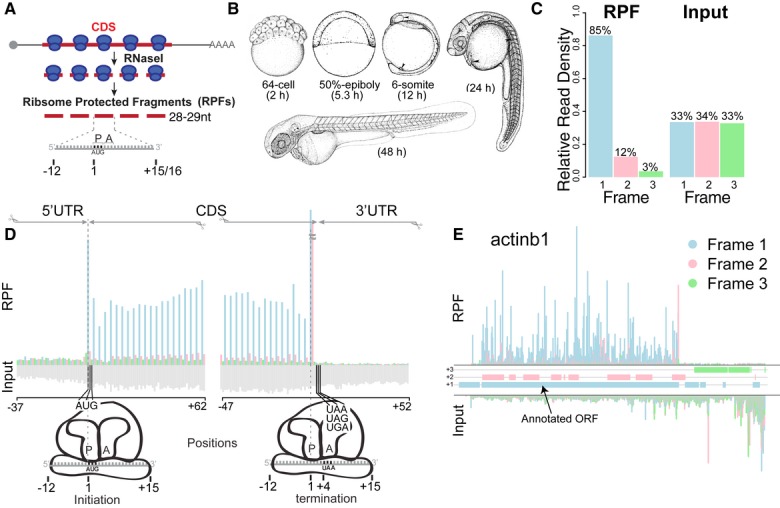
Schematic representation of ribosome profiling: 28 to 29-nt-long ribosome-protected fragments (RPFs) are generated from nuclease digestion, where the P-site of the ribosome is in position 13.
Developmental stages at which ribosome profiling was performed.
Subcodon position of the ribosome footprints (position 13) for the RPF and input reads. Plot shows the proportion of RPFs or input reads aligned to the coding sequence of RefSeq genes at each position relative to the codon. Input reads were obtained after poly-(A) fractionation and random fragmentation of the naked RNA.
RPFs and input reads mapped to a composite RefSeq transcript. RPFs mainly map to the CDS with a 3-nucleotide periodicity. RPF reads are colored as in (C) based on the position with respect to the frame of the CDS. Input reads map to both the UTRs and CDS (gray).
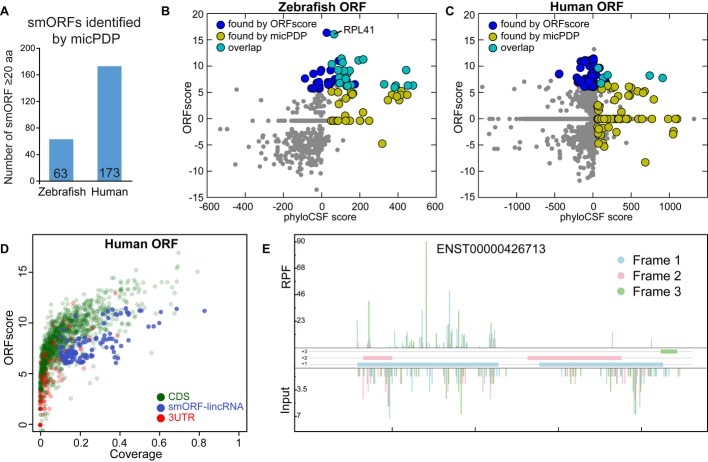
Subcodon profile plot showing RPF and input reads aligned to actinb1. Reads are colored based on the frame (1, 2 or 3) position relative to the transcript (Michel et al, 2012). All putative ORFs (distal AUG-Stop) were also colored for each respective frame (blue, pink and green boxes). Note that most of the RPFs from the annotated ORF match the color of the box, consistent with a strong in-frame distribution of reads within individual transcripts.
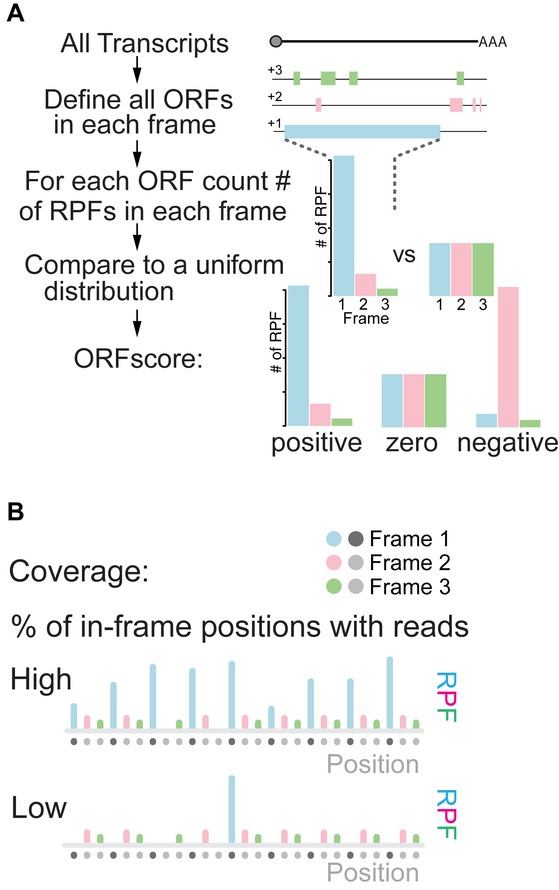
Workflow to define the ORFscore: Top diagram represents a transcript, below solid bars represent all possible ORFs (Distal AUG-Stop) identified in each frame (+1, +2, +3). The RPF distribution in each frame is compared to an equally sized uniform distribution using a modified chi-squared statistic (see Materials and Methods). The resulting ORFscore is assigned a negative value when the distribution of RPFs is inconsistent with the frame of the CDS.
Coverage is determined by measuring the proportion of in-frame CDS positions with ≥ 1 reads.
Comment in
-
Everything old is new again: (linc)RNAs make proteins!EMBO J. 2014 May 2;33(9):937-8. doi: 10.1002/embj.201488303. Epub 2014 Apr 9. EMBO J. 2014. PMID: 24719208 Free PMC article.
References
-
- Birney E, Stamatoyannopoulos JA, Dutta A, Guigo R, Gingeras TR, Margulies EH, Weng Z, Snyder M, Dermitzakis ET, Thurman RE, Kuehn MS, Taylor CM, Neph S, Koch CM, Asthana S, Malhotra A, Adzhubei I, Greenbaum JA, Andrews RM, Flicek P, et al. Identification and analysis of functional elements in 1% of the human genome by the ENCODE pilot project. Nature. 2007;447:799–816. - PMC - PubMed
Publication types
MeSH terms
Substances
Associated data
- Actions
Grants and funding
- R01GM103789-01/GM/NIGMS NIH HHS/United States
- R01 GM097194/GM/NIGMS NIH HHS/United States
- R01 GM095982/GM/NIGMS NIH HHS/United States
- R01HD074078-02/HD/NICHD NIH HHS/United States
- R01GM081602-06/GM/NIGMS NIH HHS/United States
- F32 HD071697/HD/NICHD NIH HHS/United States
- R01 GM103789/GM/NIGMS NIH HHS/United States
- R01 GM101108/GM/NIGMS NIH HHS/United States
- UL1 TR000142/TR/NCATS NIH HHS/United States
- R01GM095982/GM/NIGMS NIH HHS/United States
- R01 HD074078/HD/NICHD NIH HHS/United States
- F32HD071697-02/HD/NICHD NIH HHS/United States
- R01GM097194/GM/NIGMS NIH HHS/United States
- T32GM007499/GM/NIGMS NIH HHS/United States
- R01 GM081602/GM/NIGMS NIH HHS/United States
- T32 GM007499/GM/NIGMS NIH HHS/United States
LinkOut - more resources
Full Text Sources
Other Literature Sources
Molecular Biology Databases
