. 2014 May;6(5):685-701.
doi: 10.1002/emmm.201303347.

The unfolded protein response affects readthrough of premature termination codons

Affiliations

The unfolded protein response affects readthrough of premature termination codons

Yifat S Oren et al. EMBO Mol Med. 2014 May.

Abstract

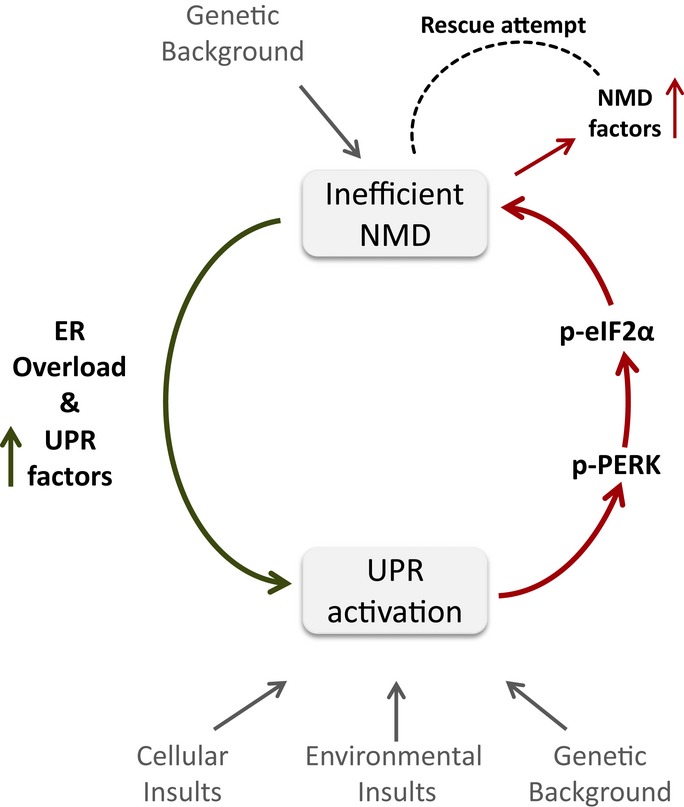
One-third of monogenic inherited diseases result from premature termination codons (PTCs). Readthrough of in-frame PTCs enables synthesis of full-length functional proteins. However, extended variability in the response to readthrough treatment is found among patients, which correlates with the level of nonsense transcripts. Here, we aimed to reveal cellular pathways affecting this inter-patient variability. We show that activation of the unfolded protein response (UPR) governs the response to readthrough treatment by regulating the levels of transcripts carrying PTCs. Quantitative proteomic analyses showed substantial differences in UPR activation between patients carrying PTCs, correlating with their response. We further found a significant inverse correlation between the UPR and nonsense-mediated mRNA decay (NMD), suggesting a feedback loop between these homeostatic pathways. We uncovered and characterized the mechanism underlying this NMD-UPR feedback loop, which augments both UPR activation and NMD attenuation. Importantly, this feedback loop enhances the response to readthrough treatment, highlighting its clinical importance. Altogether, our study demonstrates the importance of the UPR and its regulatory network for genetic diseases caused by PTCs and for cell homeostasis under normal conditions.


Figures

Figure 1
Figure 1
Differential UPR activation between two patients carrying the W1282X stop mutation in the CFTR gene. SILAC-based quantitative proteomic analysis of lymphoblastoid cell lines. A histogram of overall protein ratios shows high similarity between the patient-derived cells, with only 440 showing statistically significant differences (Significance < 0.05; Significant). Significantly different ER resident proteins (ER) are higher in the responsive CF patient.
Figure 2
Figure 2
The effect of UPR activation on the CFTR chloride efflux following G418 treatment. A Halide efflux was measured using the SPQ fluorescence assay. Forskolin (20 μM) and genistein (50 μM) were added (solid arrow) to stimulate CFTR-dependent ion transport (rate of upward deflection tracks CFTR activity before and after pharmacologic stimulation). The findings indicate upregulation of CFTR following combined treatment with G418 and tunicamycin. Dotted arrow = addition of dequenching buffer; double arrow = addition of quenching buffer. B Summary data indicating stimulated efflux rate by treatment group. *= 0.016 by ANOVA;= 9–10 coverslips/condition, > 15 cells monitored per coverslip.
Figure 3
Figure 3
The effect of UPR activation on XLF function following G418 treatment. A, B P133 cells were grown in the presence or absence of 250 μg/ml G418 for 24 h with (A) or without (B) UPR induction by 10 mM DTT treatment for 3 h. Cells were allowed to recover for 6 h and then treated with 0.65 pg/μl NCS for 10 min. Cells were then harvested at the indicated times following the NCS wash. Protein extracts were prepared and analyzed by immunoblotting with anti-γH2AX and anti-tubulin antibodies. C Quantification of γH2AX levels normalized to tubulin.
Figure 4
Figure 4
UPR activation leads to upregulation of transcripts carrying disease-causing PTCs. A–C CFP15a (A), LPIN1 (B), and P133 (C) cells were treated with DTT (10 mM) for 2, 3, and 5 h. The level of SC35 1.6, SC35 1.7 and the level of CFTR or LPIN1 or XLF1 transcripts were measured by RT-qPCR. The values shown are the average fold change (mean ± s.e.m.) from at least three independent experiments relative to nontreated cells. Values were normalized against transcripts of RNA polymerase II gene. Statistical analysis was performed using Student's t-test (one-tailed, paired). *< 0.05, **< 0.01, ***< 0.001.
Figure 5
Figure 5
NMD inhibition activates the PERK-peIF2α UPR branch. A, B HEK293T, HeLa, and CF15a cells were transfected with siRNA against hUPF1 or nonspecific control siRNA (scr) for 48 or 72 h. (A) Protein extracts were prepared and analyzed by immunoblotting with anti-hUPF1, anti-tubulin, and anti-peIF2α antibodies. (B) Levels of SC35 1.6, SC35 1.7, and CARS transcripts were measured by RT-qPCR. The values shown are the average fold change (mean ± s.e.m.) from at least three independent experiments relative to nontreated cells or cells transfected with a nonspecific control siRNA. Values were normalized against transcripts of RNA polymerase II gene (HEK293T and HeLa) or GAPDH (CFP15a). The values shown are the average fold change (mean ± s.e.m.) from at least three independent experiments relative to nontreated cells. Values were normalized against transcripts of RNA polymerase II gene. Statistical analysis was performed using Student's t-test (one-tailed, paired). *< 0.05, **< 0.01, ***< 0.001. C HEK293T, HeLa, and CFP15a cells were treated with TM (25 μg/ml) for 3 h or DTT (10 mM) for 2 h. Protein extracts were prepared and analyzed by immunoblotting with anti-tubulin and anti-peIF2α antibodies.
Figure 6
Figure 6
A positive feedback loop between the NMD and the UPR mechanisms. A HEK293T cells were transfected with siRNA against hUPF1 or nonspecific control siRNA (scr) for 72 h. Levels of ATF3, ATF4, CHOP, and ASNS transcripts were measured by RT-qPCR. The values shown are the average fold change (mean ± s.e.m.) from at least three independent experiments relative to nontreated cells. Values were normalized against transcripts of RNA polymerase II gene. Statistical analysis was performed using Student's t-test (one-tailed, paired). *< 0.05, **< 0.01, ***< 0.001. B HeLa cells were treated with DTT (10 mM) for 2 and 5 h or transfected with siRNA against hUPF1 or nonspecific control siRNA (scr) for 48 h. The levels of the NMD factors transcripts were measured by RT-qPCR. Data were quantified and statistically analyzed as in (A). C–E HEK293T cells were transfected with siRNA against hUPF1 or nonspecific control siRNA (scr) for 72 h with or without DTT treatment (10 mM) for 2 or 3 h. (C) Protein extracts were prepared and analyzed by immunoblotting with anti-hUPF1, anti-tubulin, and anti-peIF2α antibodies. (D) Levels of spliced XBP1 and (E) SC35 1.6, CARS, SMG1, and ATF3 transcripts were measured by RT-qPCR. Data were quantified and statistically analyzed as in (A). All the changes following UPR activation by DTT and UPF1 downregulation were significantly higher compared to nontreated or scr cells. Black asterisks: scr DTT/siUPF1 DTT. Gray asterisks: siUPF1 DTT/siUPF1. F–H HEK293T cells were transfected with siRNAs against PERK or nonspecific control siRNA (scr) for 72 h with or without DTT treatment (10 mM) for 3 h. (F) Protein extracts were prepared and analyzed by immunoblotting with anti-PERK, anti-tubulin, anti-β catenin, and anti-peIF2α antibodies. (G) Levels of SC35 1.6, CARS, and SMG1. (H) Levels of spliced XBP1 (P-value = 0.05). I SC35 1.6, SC35 1.7, SMG1 and sXBP1 transcripts were measured by RT-qPCR. Data represent the ratio between 6538 and 6537 lymphoblastoid cell lines. Data were quantified and statistically analyzed as in (A).
Figure 7
Figure 7
Feedback-loop regulatory network between the NMD and UPR pathways augments both the activation of the UPR and the attenuation of NMD and confers homeostasis under genetic, environmental, and/or cellular insults.
Figure 8
Figure 8
A negative correlation between NMD and UPR factors. A–D Hierarchical clustering (A, C) and scatter plots (B, D) of 58 NMD and UPR factors in 16 primary lymphocytes from CF patients (A, B) and commonly used cell lines (Geiger et al, 2012) (C, D). For the scatter plots, we averaged the normalized ratio values (primary lymphocytes) or normalized intensities (cell lines) of each group of proteins (NMD or UPR).
Figure 9
Figure 9
NMD inhibition together with UPR activation enhances the response to readthrough treatment. P133 cells were transfected with siRNA against hUPF1 or nonspecific control siRNA (scr) for 72 h. DTT, G418, and NCS treatments were performed as described in Fig 3A. A Protein extracts were prepared and analyzed by immunoblotting with anti-hUPF1, anti-γH2AX, and anti-tubulin antibodies. B Quantification of Ub-γH2AX levels normalized to tubulin. All siUPF1 samples were normalized according to the nontreated siUPF1. Data represent the fold change of Ub-γH2AX in siUPF1 compared to scr, for each indicated treatment. Quantification is an average of two experiments.

Similar articles

Cited by

References

    1. Ahnesorg P, Smith P, Jackson SP. XLF interacts with the XRCC4-DNA ligase IV complex to promote DNA nonhomologous end-joining. Cell. 2006;124:301–313. - PubMed
    1. Ashburner M, Ball CA, Blake JA, Botstein D, Butler H, Cherry JM, Davis AP, Dolinski K, Dwight SS, Eppig JT, et al. Gene ontology: tool for the unification of biology. The Gene Ontology Consortium. Nat Genet. 2000;25:25–29. - PMC - PubMed
    1. Austin RC. The unfolded protein response in health and disease. Antioxid Redox Signal. 2009;11:2279–2287. - PubMed
    1. Barton-Davis ER, Cordier L, Shoturma DI, Leland SE, Sweeney HL. Aminoglycoside antibiotics restore dystrophin function to skeletal muscles of mdx mice. J Clin Invest. 1999;104:375–381. - PMC - PubMed
    1. Bartoszewski R, Rab A, Twitty G, Stevenson L, Fortenberry J, Piotrowski A, Dumanski JP, Bebok Z. The mechanism of cystic fibrosis transmembrane conductance regulator transcriptional repression during the unfolded protein response. J Biol Chem. 2008;283:12154–12165. - PubMed

Publication types