. 2014 Jun;27(6):663-71.
doi: 10.1002/nbm.3103. Epub 2014 Apr 6.

Reproducibility of creatine kinase reaction kinetics in human heart: a (31) P time-dependent saturation transfer spectroscopy study

Affiliations

Reproducibility of creatine kinase reaction kinetics in human heart: a (31) P time-dependent saturation transfer spectroscopy study

Adil Bashir et al. NMR Biomed. 2014 Jun.

Abstract

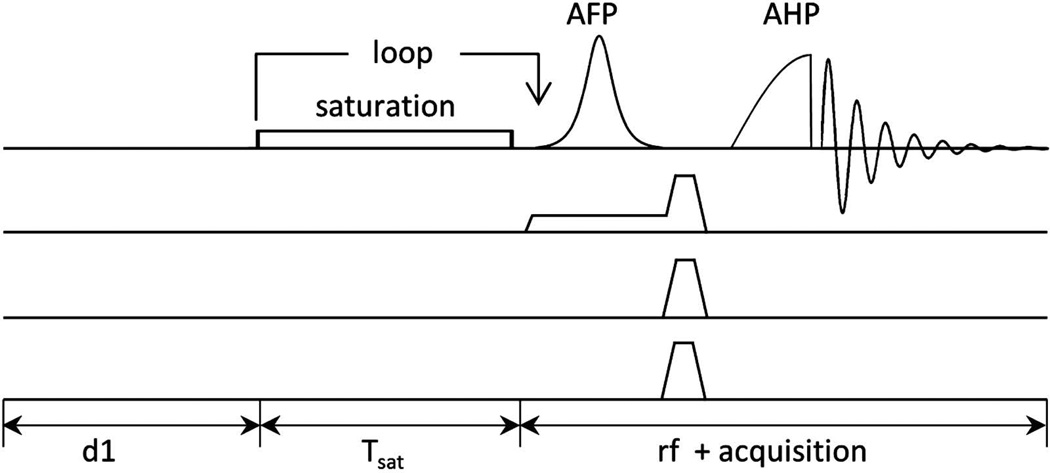
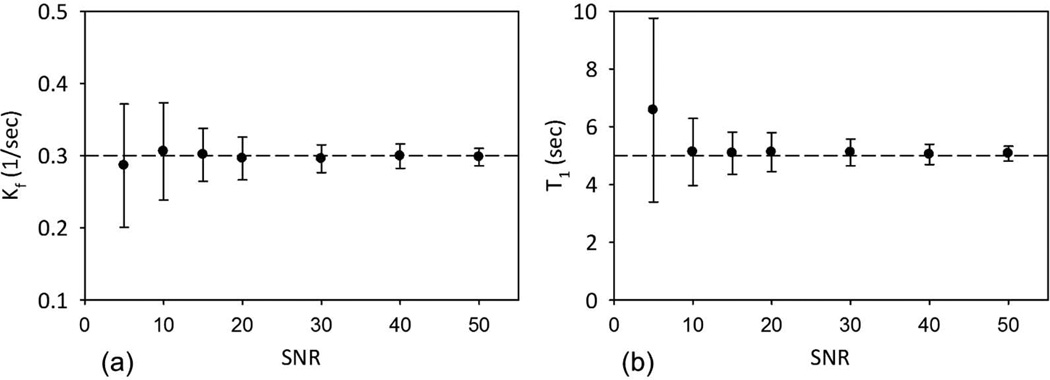
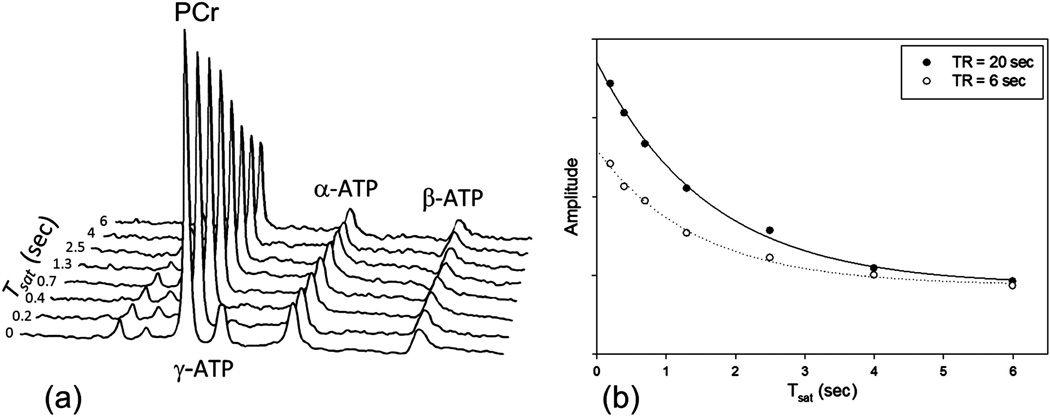
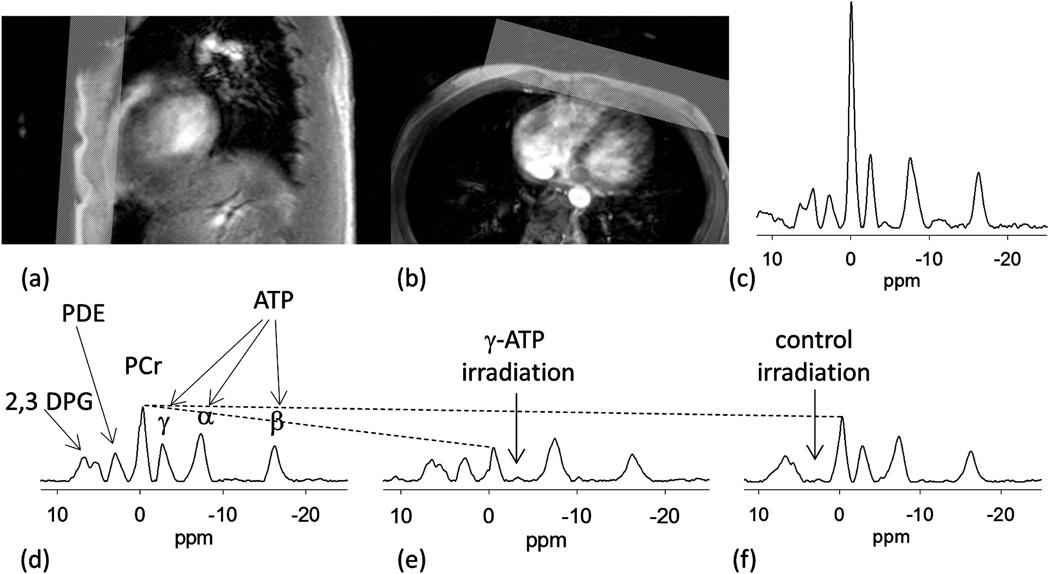
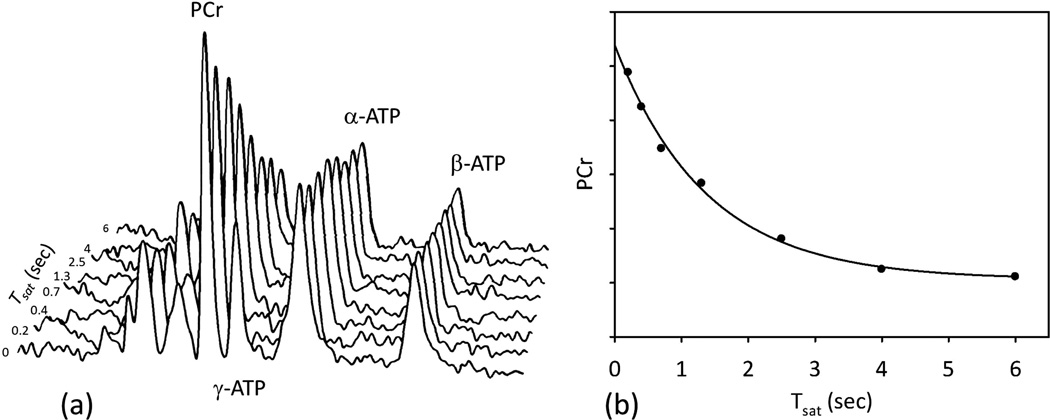
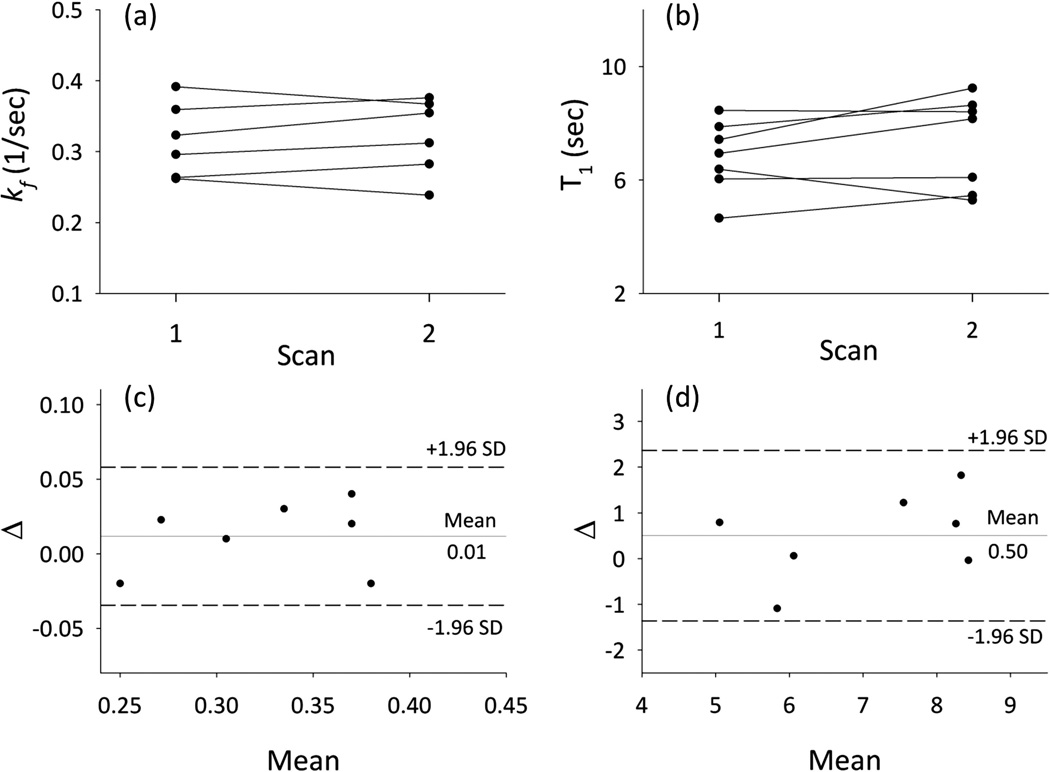
Creatine kinase (CK) is essential for the buffering and rapid regeneration of adenosine triphosphate (ATP) in heart tissue. Herein, we demonstrate a (31) P MRS protocol to quantify CK reaction kinetics in human myocardium at 3 T. Furthermore, we sought to quantify the test-retest reliability of the measured metabolic parameters. The method localizes the (31) P signal from the heart using modified one-dimensional image-selected in vivo spectroscopy (ISIS), and a time-dependent saturation transfer (TDST) approach was used to measure CK reaction parameters. Fifteen healthy volunteers (22 measurements in total) were tested. The CK reaction rate constant (kf ) was 0.32 ± 0.05 s(-1) and the coefficient of variation (CV) was 15.62%. The intrinsic T1 for phosphocreatine (PCr) was 7.36 ± 1.79 s with CV = 24.32%. These values are consistent with those reported previously. The PCr/ATP ratio was equal to 1.94 ± 0.15 with CV = 7.73%, which is within the range of healthy subjects. The reproducibility of the technique was tested in seven subjects and inferred parameters, such as kf and T1 , exhibited good reliability [intraclass correlation coefficient (ICC) of 0.90 and 0.79 for kf and T1 , respectively). The reproducibility data provided in this study will enable the calculation of the power and sample sizes required for clinical and research studies. The technique will allow for the examination of cardiac energy metabolism in clinical and research studies, providing insight into the relationship between energy deficit and functional deficiency in the heart.

Keywords: 31P MRS; adenosine triphosphate (ATP); creatine kinase; heart; image-selected in vivo spectroscopy (ISIS); reproducibility; saturation transfer; time-dependent saturation transfer (TDST).


Figures

Figure 1
Figure 1
(a) Schematic Pulse sequence for time dependent magnetization transfer using 1D-ISIS localization. The selective spectral saturation is achieved by a low power RF pulse centered on the γ-ATP resonance. Saturation times are varied by looping over the saturation pulse with 1 ms gap between the successive pulses. An adiabatic full passage pulse immediately follows the saturation pulse train for ISIS localization. Spoiling gradients are used before excitation to disperse any residual transverse magnetization.
Figure 2
Figure 2
(a) Image of two compartment phantom showing the location of the RF coil. The shaded region represents position of ROI. (b) Front spectrum shows the signal from the phantom without any localization and a large peak from phenylphosphonic acid compartment closer to the RF coil is visible. Spectrum in the back is the result of addition of two spectra with and without the inversion of spins in the selected ROI. The addition of the two spectra shows almost complete suppression of spectral peak from phenylphosphonic acid. (c) The image of the phantom, location of ROI and 1D-spectrum. Red spectrum shows the signal without saturation band and the signal in the selected ROI is eliminated when the saturation band is placed. The decaying profile of spectrum represents the loss of sensitivity of the surface coil with distance from the coil.
Figure 3
Figure 3
(a) Spectrum demonstrating calibration of AHP pulse. Spectrum amplitude initially increased with B1 field strength and reached a maximum value at B1 = 0.7 kHz. Further increase in B1 did not affect the spectral peak intensity confirming uniform 90° excitation over the region of interest. (b) Plot shows the frequency dependence of AHP pulse. The adiabatic conditions were met in ~400 Hz around the resonance frequency. This bandwidth is appropriate to simultaneously quantify PCr and γ-ATP which are approximately 120 Hz apart at 3T.
Figure 4
Figure 4
Mean CK reaction rate constant (kf) (a) and T1 (b) and corresponding standard deviation are shown as a function of SNR from Monte Carlo simulations. Although the percentage error is small even for low SNR the standard deviation in the measured reaction rate increases.
Figure 5
Figure 5
(a) Representative TDST spectra from the leg. The PCr peak intensity decreases as the saturation time for γ-ATP is increased. (b) Data and fitting results shown for long (d1 = 20 sec) and short (d1 = 6 sec). The plots show similar apparent relaxation rate constant and steady state magnetization. Short TR acquisition resulted in 63% time savings for the experiment.
Figure 6
Figure 6
Sagittal (a) and axial (b) reference images of the heart and placement of the ROI. (b) A small fiducial marking the center of the RF coil is visible in the images. (c) Spectrum without localization shows a large PCr peak relative to ATP indicating signal arising from the chest muscles. (d) Typical spectrum from heart without selective RF irradiation detailing the peaks of PCr, ATP, PDE and 2,3 DPG. (e) Representative spectra from a saturation transfer experiment when γ-ATP peak is saturated. The decrease in PCr peak is due to the transfer of saturation between γ-ATP and PCr through the CK reaction. (f) Control spectrum with selective RF irradiation at 2.5 ppm. The arrows identify the frequency of the saturating irradiation. The dotted line gives a visual cue of direct saturation of PCr peak due to imperfect selectivity of saturating pulse.
Figure 7
Figure 7
(a) Example spectra representing a TDST experiment from the heart. The PCr peak intensity decreased as the saturation time (Tsat) was increased. The decrease in PCr peak is due to ATP production via CK reaction. (b) Calculation of apparent PCr relaxation time constant (τ) and the steady state PCr magnetization (MPCrss).
Figure 8
Figure 8
Individual data for kf (a) and T1 (b) during each test. Bland-Altman plots of the repeatability between the measurements of the same subject (c) kf and (d) T1.

References

    1. Lipskaya TY. Mitochondrial creatine kinase: properties and function. Biochemistry (Mosc) 2001;66(10):1098–1111. - PubMed
    1. Nascimben L, Ingwall JS, Pauletto P, Friedrich J, Gwathmey JK, Saks V, Pessina AC, Allen PD. Creatine kinase system in failing and nonfailing human myocardium. Circulation. 1996;94(8):1894–1901. - PubMed
    1. De Sousa E, Veksler V, Minajeva A, Kaasik A, Mateo P, Mayoux E, Hoerter J, Bigard X, Serrurier B, Ventura-Clapier R. Subcellular creatine kinase alterations. Implications in heart failure. Circ Res. 1999;85(1):68–76. - PubMed
    1. Nascimben L, Friedrich J, Liao R, Pauletto P, Pessina AC, Ingwall JS. Enalapril treatment increases cardiac performance and energy reserve via the creatine kinase reaction in myocardium of Syrian myopathic hamsters with advanced heart failure. Circulation. 1995;91(6):1824–1833. - PubMed
    1. Tian R, Nascimben L, Kaddurah-Daouk R, Ingwall JS. Depletion of energy reserve via the creatine kinase reaction during the evolution of heart failure in cardiomyopathic hamsters. Journal of molecular and cellular cardiology. 1996;28(4):755–765. - PubMed

Publication types