Interannual variation in nitrous oxide emissions from perennial ryegrass/white clover grassland used for dairy production
- PMID: 24706411
- PMCID: PMC4282278
- DOI: 10.1111/gcb.12595
Interannual variation in nitrous oxide emissions from perennial ryegrass/white clover grassland used for dairy production
Abstract
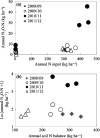
Nitrous oxide (N2 O) emissions are subject to intra- and interannual variation due to changes in weather and management. This creates significant uncertainties when quantifying estimates of annual N2 O emissions from grazed grasslands. Despite these uncertainties, the majority of studies are short-term in nature (<1 year) and as a consequence, there is a lack of data on interannual variation in N2 O emissions. The objectives of this study were to (i) quantify annual N2 O emissions and (ii) assess the causes of interannual variation in emissions from grazed perennial ryegrass/white clover grassland. Nitrous oxide emissions were measured from fertilized and grazed perennial ryegrass/white clover grassland (WC) and from perennial ryegrass plots that were not grazed and did not receive N input (GB), over 4 years from 2008 to 2012 in Ireland (52°51'N, 08°21'W). The annual N2 O-N emissions (kg ha(-1); mean ± SE) ranged from 4.4 ± 0.2 to 34.4 ± 5.5 from WC and from 1.7 ± 0.8 to 6.3 ± 1.2 from GB. Interannual variation in N2 O emissions was attributed to differences in annual rainfall, monthly (December) soil temperatures and variation in N input. Such substantial interannual variation in N2 O emissions highlights the need for long-term studies of emissions from managed pastoral systems.
Keywords: freeze-thaw cycles; grazing; interannual variation; nitrous oxide; rainfall; regulating factors; white clover grassland.
© 2014 The Authors. Global Change Biology Published by John Wiley & Sons Ltd.
Figures


Similar articles
-
Measured and simulated nitrous oxide emissions from ryegrass- and ryegrass/white clover-based grasslands in a moist temperate climate.PLoS One. 2011;6(10):e26176. doi: 10.1371/journal.pone.0026176. Epub 2011 Oct 10. PLoS One. 2011. PMID: 22028829 Free PMC article.
-
Micrometeorological measurements over 3 years reveal differences in N2 O emissions between annual and perennial crops.Glob Chang Biol. 2016 Mar;22(3):1244-55. doi: 10.1111/gcb.13137. Epub 2016 Jan 6. Glob Chang Biol. 2016. PMID: 26491961
-
Do establishment of multispecies swards affect nitrous oxide and methane emissions and promote soil health?Sci Total Environ. 2025 May 1;975:179091. doi: 10.1016/j.scitotenv.2025.179091. Epub 2025 Apr 3. Sci Total Environ. 2025. PMID: 40179748
-
A review of nitrous oxide mitigation by farm nitrogen management in temperate grassland-based agriculture.J Environ Manage. 2013 Oct 15;128:893-903. doi: 10.1016/j.jenvman.2013.06.026. Epub 2013 Jul 20. J Environ Manage. 2013. PMID: 23880433 Review.
-
Meta-analysis of global livestock urine-derived nitrous oxide emissions from agricultural soils.Glob Chang Biol. 2020 Apr;26(4):2002-2013. doi: 10.1111/gcb.15012. Epub 2020 Feb 13. Glob Chang Biol. 2020. PMID: 31975492 Free PMC article. Review.
Cited by
-
Machine learning reveals dynamic controls of soil nitrous oxide emissions from diverse long-term cropping systems.J Environ Qual. 2025 Jan-Feb;54(1):132-146. doi: 10.1002/jeq2.20637. Epub 2024 Oct 9. J Environ Qual. 2025. PMID: 39384550 Free PMC article.
-
Carbon Footprint of Mediterranean Pasture-Based Native Beef: Effects of Agronomic Practices and Pasture Management under Different Climate Change Scenarios.Animals (Basel). 2020 Mar 2;10(3):415. doi: 10.3390/ani10030415. Animals (Basel). 2020. PMID: 32131471 Free PMC article.
References
-
- Abdalla M, Jones M, Smith P, Williams M. Nitrous oxide fluxes and denitrification sensitivity to temperature in Irish pasture soils. Soil Use and Management. 2009;25:376–388.
-
- Bateman EJ, Baggs EM. Contributions of nitrification and denitrification to N2O emissions from soils at different water-filled pore space. Biology and Fertility of Soils. 2005;41:379–388.
-
- van Bochove E, Prévost D, Pelletier F. Effects of freeze–thaw and soil structure on nitrous oxide produced in a clay soil. Soil Science Society of America Journal. 2000;64:1638–1643.
-
- de Bruijn AMG, Butterbach-Bahl K, Blagodatsky S, Grote R. Model evaluation of different mechanisms driving freeze-thaw N2O emissions. Agriculture Ecosystems & Environment. 2009;133:196–207.
-
- Cai YJ, Ding WX, Luo JF. Nitrous oxide emissions from Chinese maize-wheat rotation systems: a 3-year field measurement. Atmospheric Environment. 2013;65:112–122.
Publication types
MeSH terms
Substances
LinkOut - more resources
Full Text Sources
Other Literature Sources
Research Materials

