Clinical Trial
. 2014 Aug;60(2):477-86.
doi: 10.1002/hep.27158. Epub 2014 May 14.

Antiretroviral therapy, interferon sensitivity, and virologic setpoint in human immunodeficiency virus/hepatitis C virus coinfected patients

Affiliations
Clinical Trial

Antiretroviral therapy, interferon sensitivity, and virologic setpoint in human immunodeficiency virus/hepatitis C virus coinfected patients

Ashwin Balagopal et al. Hepatology. 2014 Aug.

Abstract

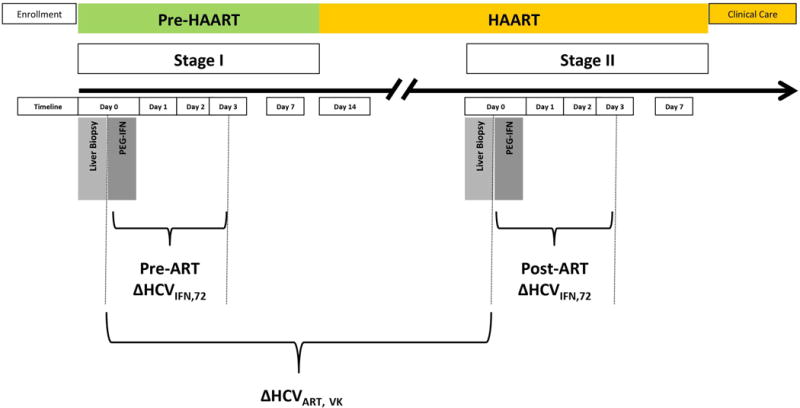
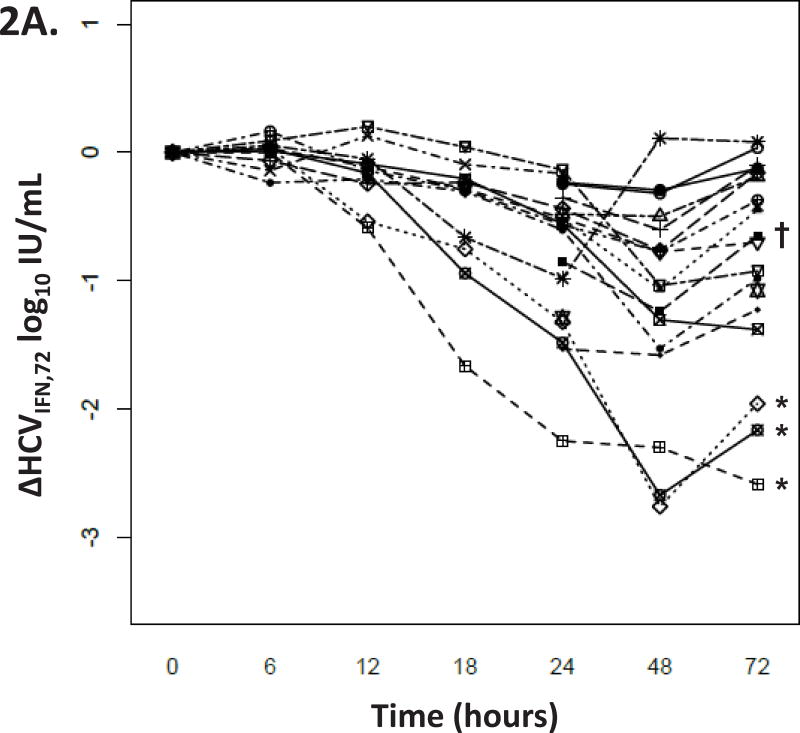
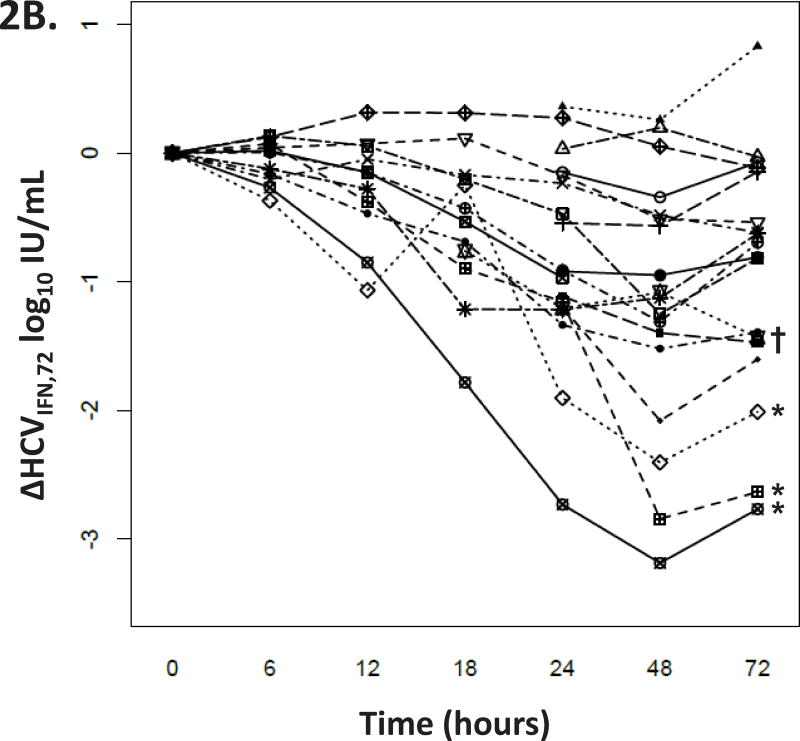
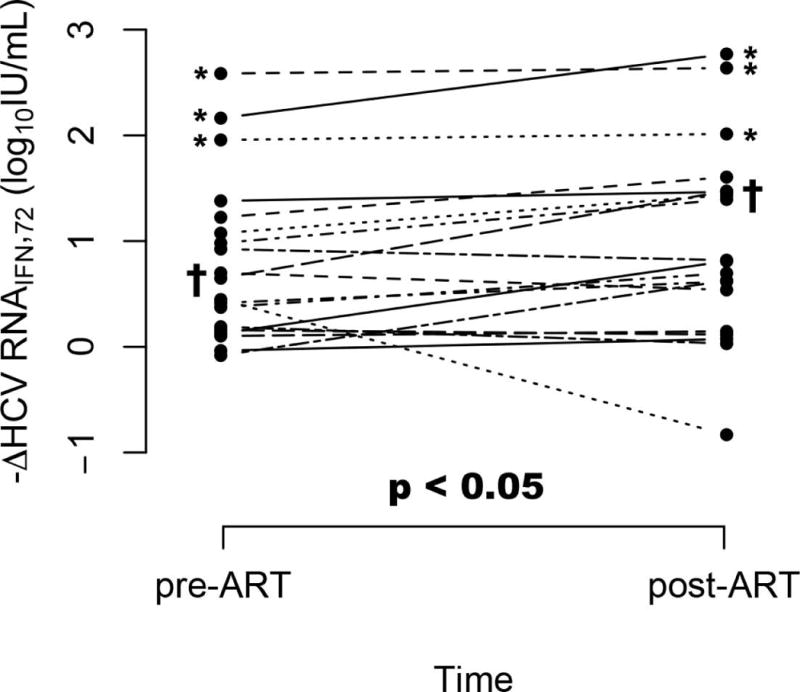
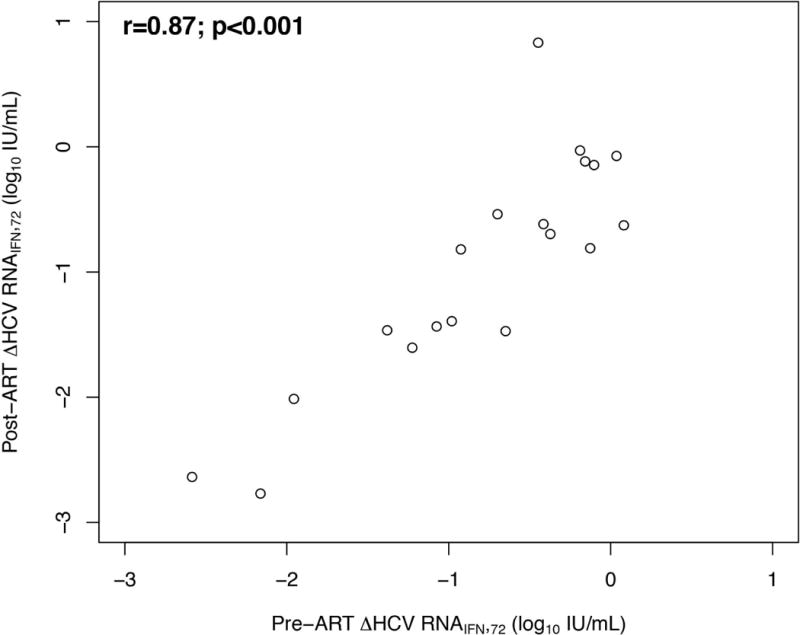
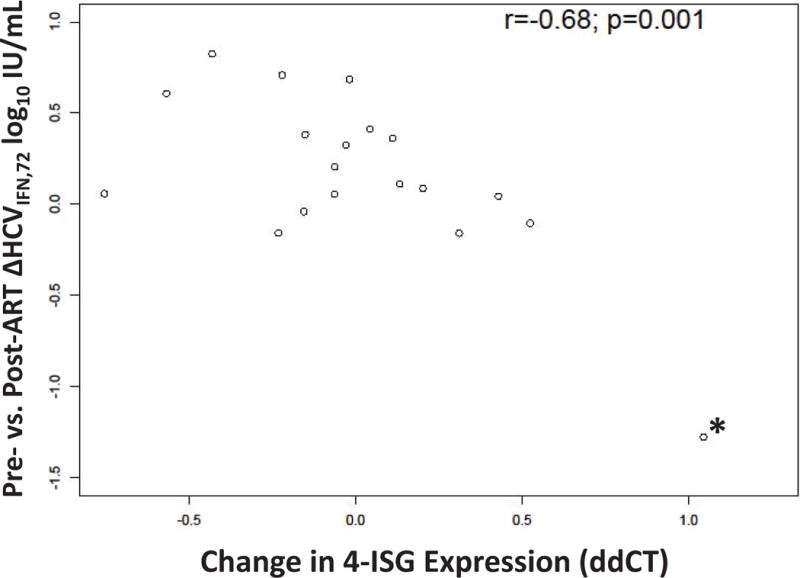
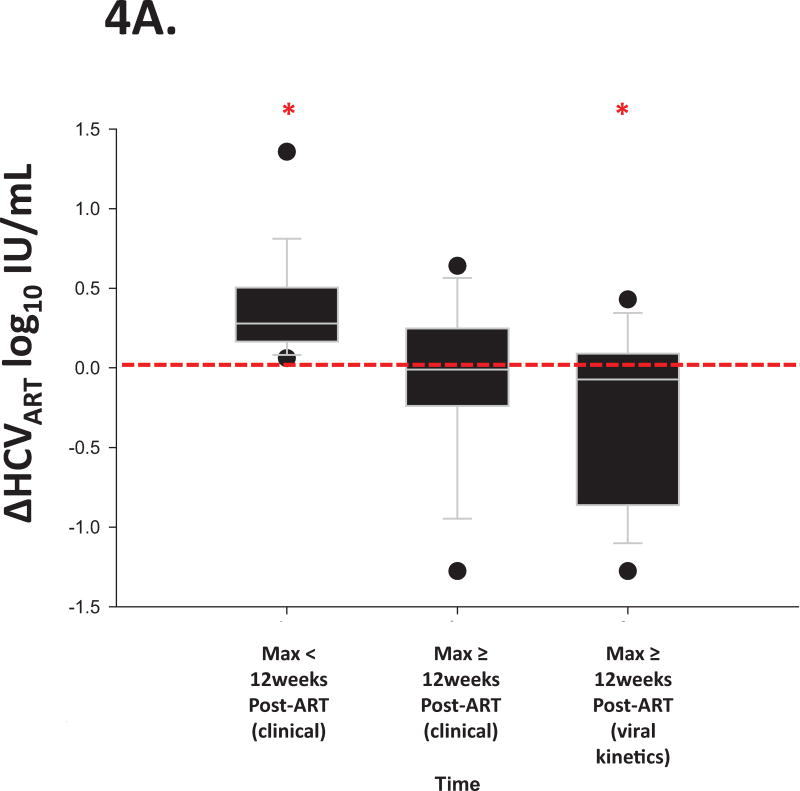
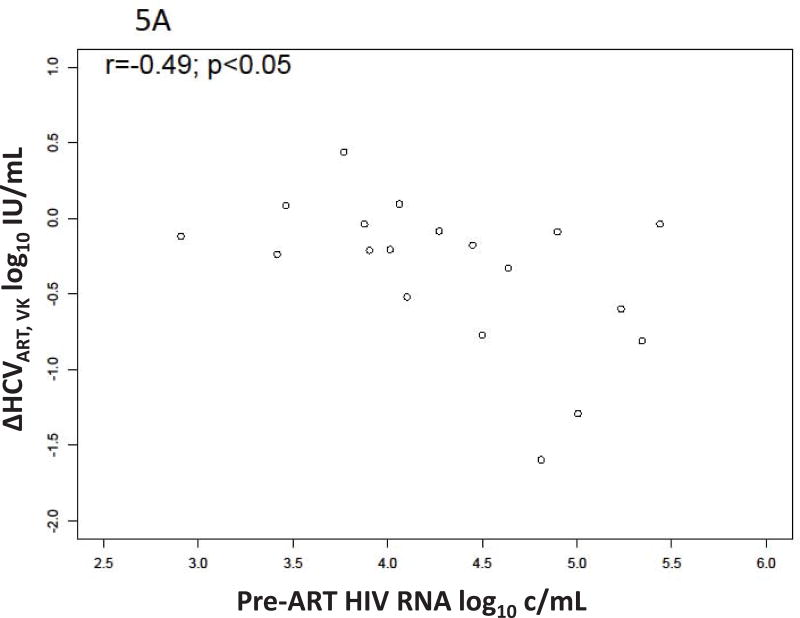
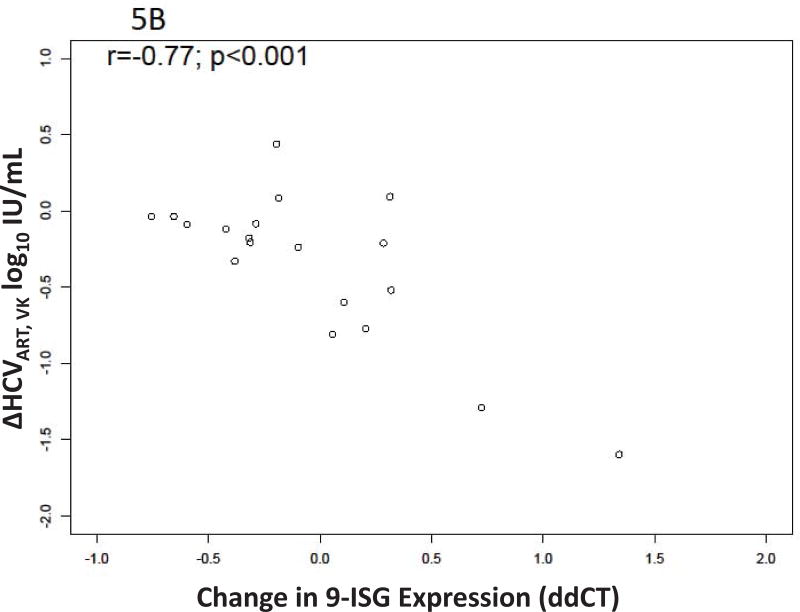
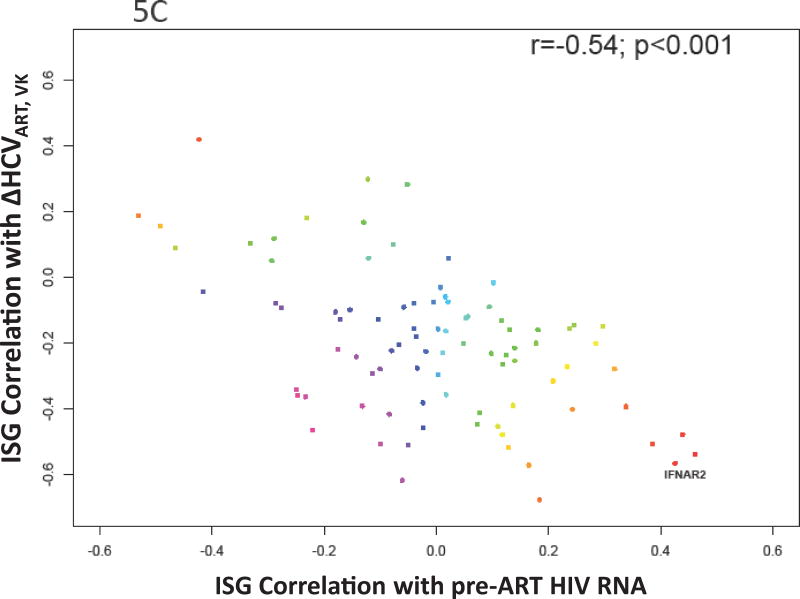
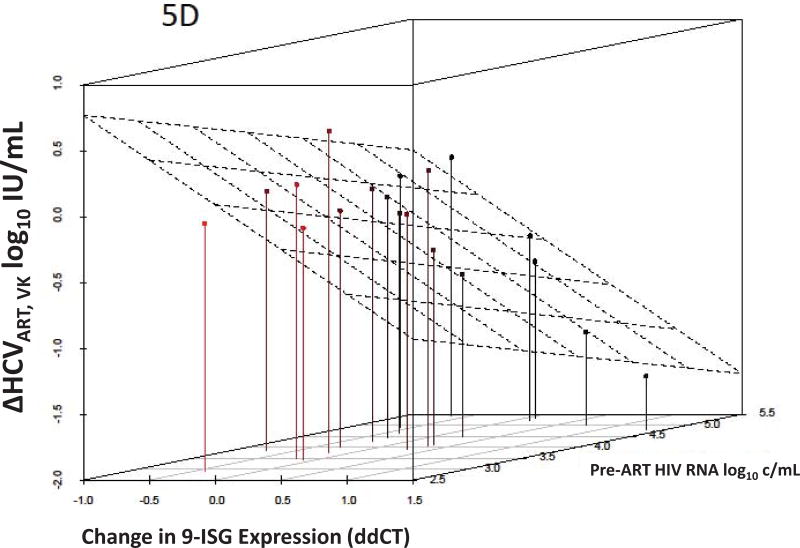
Human immunodeficiency virus (HIV) and hepatitis C virus (HCV) cause substantial mortality, especially in persons chronically infected with both viruses. HIV infection raises plasma HCV RNA levels and diminishes the response to exogenous alpha interferon (IFN). The degree to which antiretroviral therapy (ART) control of infection overcomes these HIV effects is unknown. Participants with HIV-HCV coinfection were enrolled in a trial to measure HCV viral kinetics after IFN administration (ΔHCVIFN ) twice: initially before (pre-ART) and then after (post-ART) HIV RNA suppression. Liver tissue was obtained 2-4 hours before each IFN injection to measure interferon stimulated genes (ISGs). Following ART, the ΔHCVIFN at 72 hours (ΔHCVIFN,72 ) increased in 15/19 (78.9%) participants by a median (interquartile range [IQR]) of 0.11 log10 IU/mL (0.00-0.40; P < 0.05). Increases in ΔHCVIFN,72 post-ART were associated with decreased hepatic expression of several ISGs (r = -0.68; P = 0.001); a 2-fold reduction in a four-gene ISG signature predicted an increase in ΔHCVIFN,72 of 0.78 log10 IU/mL (95% confidence interval [CI] 0.36,1.20). Pre- and post-ART ΔHCVIFN,72 were closely associated (r = 0.87; P < 0.001). HCV virologic setpoint also changed after ART (ΔHCVART ): transient median increases of 0.28 log10 IU/mL were followed by eventual median decreases from baseline of 0.21 log10 IU/mL (P = 0.002). A bivariate model of HIV RNA control (P < 0.05) and increased expression of a nine-gene ISG signature (P < 0.001) predicted the eventual decreased ΔHCVART .

Conclusion: ART is associated with lower post-IFN HCV RNA levels and that change is linked to reduced hepatic ISG expression. These data support recommendations to provide ART prior to IFN-based treatment of HCV and may provide insights into the pathogenesis of HIV-HCV coinfection.


Figures

Figure 1
Figure 1. Trial Overview
To examine the effect of ART on HCV IFN responses, 20 persons with HIV-HCV co-infection were enrolled and 19 completed a prospective study of HCV viral kinetics pre- (stage 1) and post- (stage 2) ART with HIV viral suppression. (Stage 1) After enrollment, laparoscopic liver biopsies were performed on participants to obtain baseline measurements of hepatic ISGs. Participants were admitted to the GRC within 4 hours of their biopsies, blood was drawn for baseline HCV RNA, and peginterferon-alfa 2b was administered. Viral kinetics were measured at regular intervals over 24 hours and participants were discharged. Subsequent viral kinetic measurements were made at 48 and 72 hours after IFN administration. After a 14 day washout, participants were started on ART and followed. (Stage 2) After HIV suppression was documented for > 12 weeks, laparoscopic liver biopsies were again performed followed by a 2nd IFN injection in a protocol that was identical to Stage 1. At the end of trial, participants were engaged in clinical care for HIV-HCV co-infection. The intervals used for the principal measurements of the study (pre-ART ΔHCVIFN, 72, post-ART ΔHCVIFN, 72, and ΔHCVART,VK) are indicated with brackets.
Figure 2
Figure 2. Pre- and post-ART HCV IFN responses
The HCV RNA decline following a single administration of peg interferon-alfa 2b (ΔHCVIFN) was measured at multiple time points (A) pre- and (B) post-ART. The HCV RNA decline was compared to the baseline HCV RNA level, as indicated. RNA was extracted and HCV RNA was quantified in batch by subject to avoid operational variability. (C) To illustrate the magnitude of the HCV RNA decline at 72 hours in the study participants pre- and post-ART, the -ΔHCVIFN, 72 is shown. The -ΔHCVIFN, 72 was increased in the same participants post-ART compared to pre-ART. * indicates participants who have non-genotype 1 infections. indicates the participant with genotype 1b infection. (D) In each participant, ΔHCVIFN,72 pre-ART was closely correlated with ΔHCVIFN,72 post-ART.
Figure 3
Figure 3. Intrahepatic ISGs predict the change in HCV IFN responses after HIV suppression
Intrahepatic ISGs were quantified by qPCR before the administration of peginterferon alfa 2b at two time points: pre- and post-ART. Y axis shows the ΔHCVIFN,72 in the second (post ART) minus the first (pre-ART) stage of the study. X axis (ddCT or 2−ΔΔCT) refers to the difference in the cycle number at which the RNA was detected in the second minus the first biopsy. A four gene ISG signature, comprising IFIT1, OAS1, MyD88, and IFITM3, appeared to best predict the change in HCV IFN responsiveness after ART. * indicates one participant who had an unexpected decrease in ΔHCVIFN,72 after ART. Re-analysis of the association between the four-gene ISG signature and the ΔHCVIFN,72 post-ART without this individual showed weak significance (r=−0.42; p=0.08).
Figure 4
Figure 4. HCV RNA level changes with ART
(A) HCV RNA was measured at enrollment and then at multiple times after ART initiation while participants were observed. At early time points after ART (<12 weeks), maximum HCV RNA levels (ΔHCVART, max<12wk) were found to increase in 18/19 participants compared to enrollment (comparison to baseline indicated by the red dotted line). At later time points (≥12 weeks), maximum HCV RNA levels first decreased to baseline (ΔHCVART,max≥12wk), and then, in 16/19 participants, to below enrollment levels (ΔHCVART,VK). (B) Transaminases AST (black) and ALT (white) did not appreciably change after ART. * p<0.05.
Figure 5
Figure 5. HCV RNA level changes are associated with HIV level pre-ART and changes in hepatic ISGs
(A) HIV RNA levels pre-ART was associated with ΔHCVART,VK. (B) The change in a composite score composed of the expression of a nine gene intrahepatic ISG signature (comprising HLA-E, MNDA, IFI16, IFNAR2, CIITA, NMI, CD86, TLR7, and IRF3) was associated with ΔHCVART,VK. (C) Shown are individual points that represent each of 89 intrahepatic ISGs that were measured pre- and post-ART. The x-axis indicates the Pearson’s correlation coefficient of the change in expression of a given ISG with HIV level. The y-axis indicates the Pearson’s correlation coefficient of the change in expression of a given ISG with ΔHCVART,VK. As an example, the change in IFNAR2 expression (denoted on the figure) with ART had a Pearson’s r=0.42 with the change in HIV RNA level from its level to undetectable levels, and had a Pearson’s r=−0.57 with ΔHCVART,VK. Overall, intrahepatic ISG changes that were most closely related to HIV level also appeared to be related to the change in HCV RNA level, while ISGs that were not related to HIV level did not appear to be related to the change in HCV RNA level. Color denotes the “strength” of the association with both HCV and HIV RNA changes: red denotes relatedness to both outcomes, while blue denotes relatedness to neither. (D) In a bivariate linear model of ΔHCVART,VK, HIV RNA level and the change in the overall expression levels of a nine gene ISG signature were independently associated with ΔHCVART,VK. Color is used to denote depth along the y-axis. An imputed plane demonstrates the relative contribution of HIV level and the nine gene ISG signature to ΔHCVART,VK.

Similar articles

Cited by

References

    1. Weber R, Sabin CA, Friis-Moller N, Reiss P, El-Sadr WM, Kirk O, Dabis F, et al. Liver-related deaths in persons infected with the human immunodeficiency virus: the D:A:D study. Arch Intern Med. 2006;166:1632–1641. - PubMed
    1. Limketkai BN, Mehta SH, Sutcliffe CG, Higgins YM, Torbenson MS, Brinkley SC, Moore RD, et al. Relationship of liver disease stage and antiviral therapy with liver-related events and death in adults coinfected with HIV/HCV. JAMA. 2012;308:370–378. - PMC - PubMed
    1. Sherman KE, Rouster SD, Chung RT, Rajicic N. Hepatitis C Virus prevalence among patients infected with Human Immunodeficiency Virus: a cross-sectional analysis of the US adult AIDS Clinical Trials Group. Clin Infect Dis. 2002;34:831–837. - PubMed
    1. Thomas DL, Shih JW, Alter HJ, Vlahov D, Cohn S, Hoover DR, Cheung L, et al. Effect of human immunodeficiency virus on hepatitis C virus infection among injecting drug users. Journal of Infectious Diseases. 1996;174:690–695. - PubMed
    1. Goedert JJ, Eyster ME, Lederman MM, Mandalaki T, De Moerloose P, White GC, 2nd, Angiolillo AL, et al. End-stage liver disease in persons with hemophilia and transfusion-associated infections. Blood. 2002;100:1584–1589. - PubMed

Publication types

MeSH terms