. 2014 Sep;35(9):4267-81.
doi: 10.1002/hbm.22516. Epub 2014 Apr 4.

Stimulus-evoked potentials contribute to map the epileptogenic zone during stereo-EEG presurgical monitoring

Affiliations

Stimulus-evoked potentials contribute to map the epileptogenic zone during stereo-EEG presurgical monitoring

Davide Boido et al. Hum Brain Mapp. 2014 Sep.

Abstract

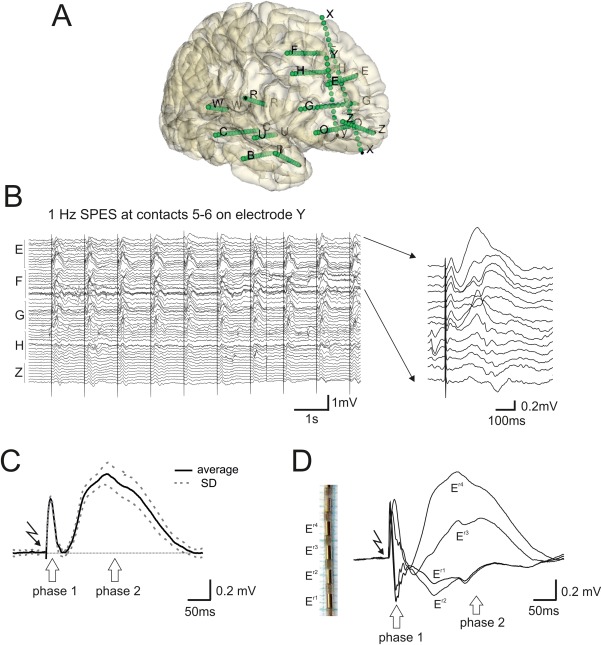
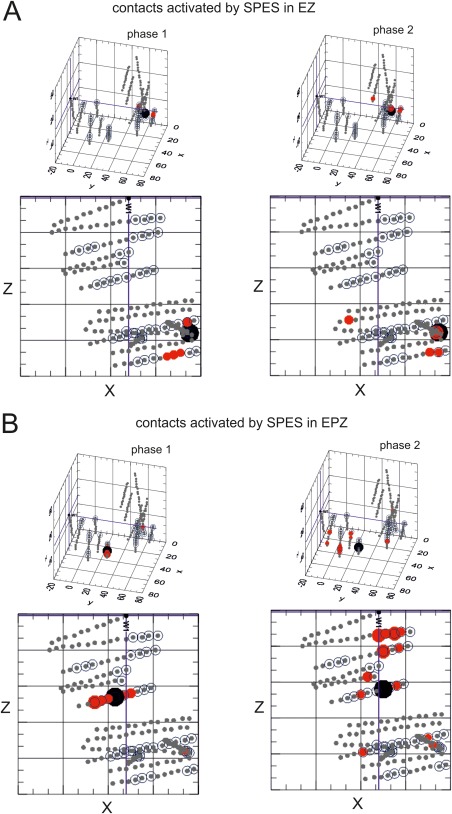
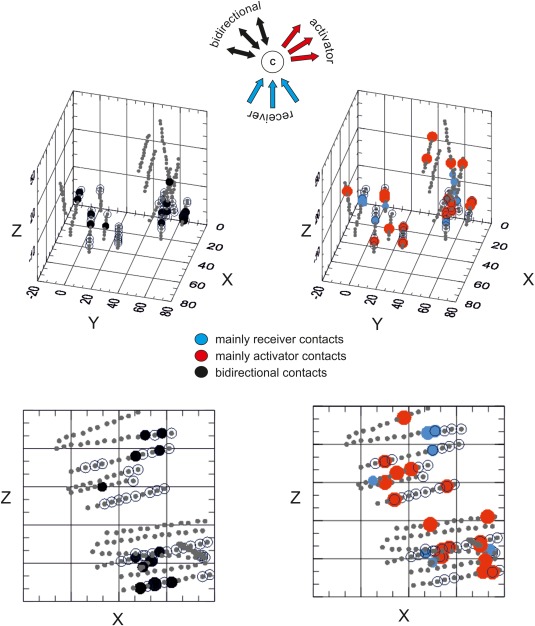
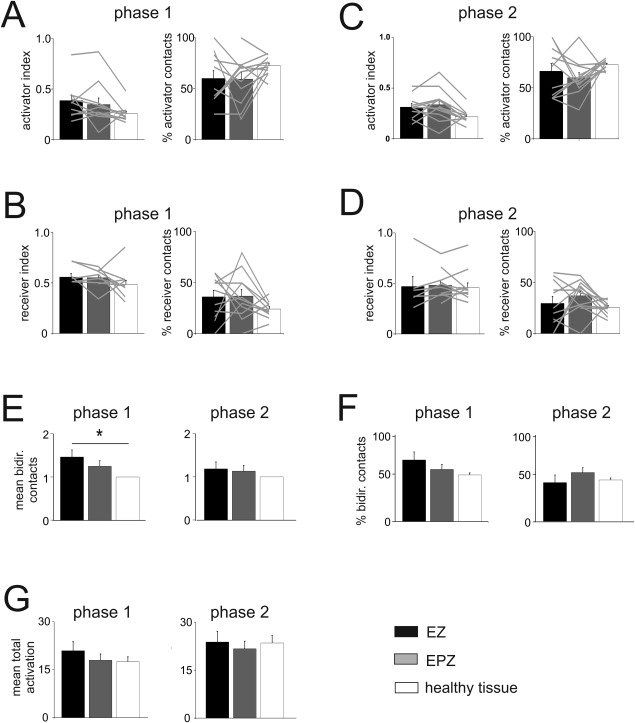
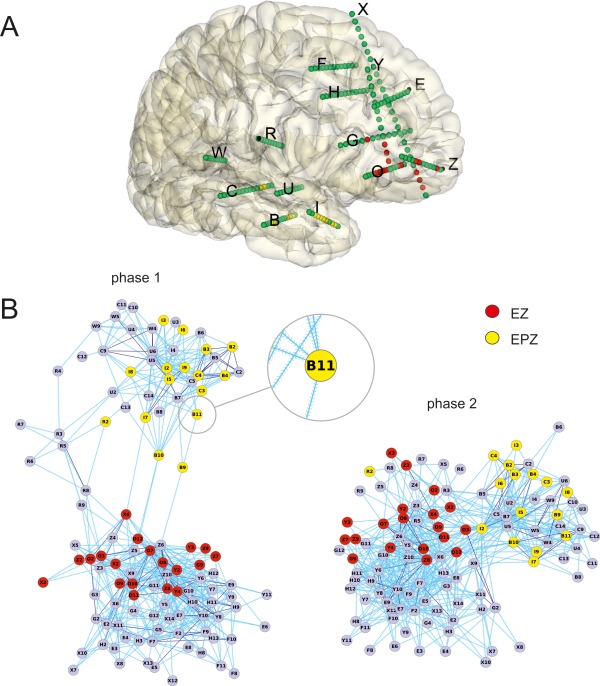
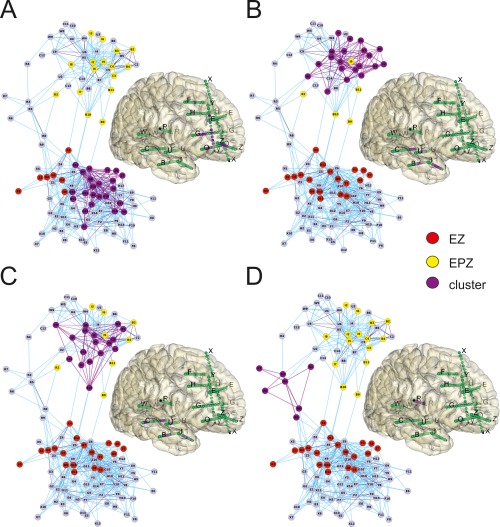
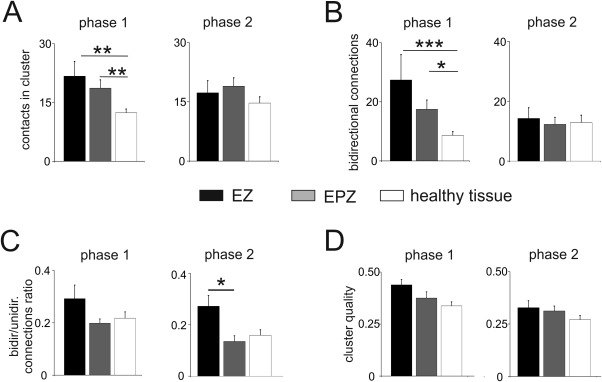
Presurgical monitoring with intracerebral electrodes in patients with drug-resistant focal epilepsy represents a standard invasive procedure to localize the sites of seizures origin, defined as the epileptogenic zone (EZ). During presurgical evaluation, intracerebral single-pulse electrical stimulation (SPES) is performed to define the boundaries of eloquent areas and to evoke seizure-associated symptoms. Extensive intracranial exploration and stimulation generate a large dataset on brain connectivity that can be used to improve EZ detection and to understand the organization of the human epileptic brain. We developed a protocol to analyse field responses evoked by intracranial stimulation. Intracerebral recordings were performed with 105-162 recording sites positioned in fronto-temporal regions in 12 patients with pharmacoresistant focal epilepsy. Recording sites were used for bipolar SPES at 1 Hz. Reproducible early and late phases (<60 ms and 60-500 ms from stimulus artefact, respectively) were identified on averaged evoked responses. Phase 1 and 2 responses recorded at all and each recording sites were plotted on a 3D brain reconstructions. Based on connectivity properties, electrode contacts were primarily identified as receivers, mainly activators or bidirectional. We used connectivity patterns to construct networks and applied cluster partitioning to study the proprieties between potentials evoked/stimulated in different regions. We demonstrate that bidirectional connectivity during phase 1 is a prevalent feature that characterize contacts included in the EZ. This study shows that the application of an analytical protocol on intracerebral stimulus-evoked recordings provides useful information that may contribute to EZ detection and to the management of surgical-remediable epilepsies.

Keywords: early propagation zone; epileptogenic zone; magnetic resonance imaging; single-pulse electrical stimulation; stereo electroencephalogram.


Figures

Figure 1
Figure 1
SEEG data analysis. A: 3D reconstruction of intracerebral electrodes tracks on MR‐CT fusion images of patient 9 (see Table 1). Letters mark different electrodes. Single recording leads are presented as dots. B: Raw bipolar signals recorded from electrodes E, F, G, H, and Z in the same patient shown in A, during a 1 Hz SPES delivered at electrode Y. Expansion of traces recorded with electrodes E and F are shown on the right. C: Average (and SD: dotted line) of 30 SPES at 1 Hz delivered at electrode Y in patient 3. Early phase 1 (<60 ms) and a late phase 2 (60–500 ms) are clearly identified. The stimulus artifact is indicated with a bolt symbol. D: Averaged bipolar potentials recorded using four consecutive recording sites on electrode E. Four recording leads are illustrated as examples on an electrode microphotograph. [Color figure can be viewed in the online issue, which is available at http://wileyonlinelibrary.com.]
Figure 2
Figure 2
Distribution of SPES‐evoked responses. A: Amplitude of supra‐threshold average integral amplitudes recorded in all SEEG recording sites during phase 1 (left panel) and phase 2 (right panel), following stimulation of a contact (large black spot) positioned in the EZ (dotted spheres). The size of red dots is proportional to the response amplitude normalized with respect to maximal responses. 3D plots with corresponding horizontal projections (bottom) B: Amplitude response plots as in A, following stimulation of a contact positioned in the EPZ. 3D plots with corresponding horizontal projections (bottom). [Color figure can be viewed in the online issue, which is available at http://wileyonlinelibrary.com.]
Figure 3
Figure 3
Activating, receiving, and bidirectional connections. Schematic representation of a contact (center dot marked with a C) as mainly receiver of inputs from other contracts (blue arrows) or mainly activator of other contacts (red arrows) is shown on top. Bidirectional relationship between coupled receiving and activating contacts are represented by black arrows. On the left, a threshold based on the number of bidirectional contacts (>4) was used to illustrate the contacts with the highest number of bidirectional connections (black dots) during phase 1 in patient 9 on a 3D space in which the position of the electrodes is reconstructed based on MR coordinates (bottom, the horizontal projection). On the right a plot of the distribution of phases 1 contacts defined mainly as receiving (blue dots) and activating (red dots) after setting a threshold value of AR‐index < 0.1 for the main activators and < 0.5 for the main receivers (see Methods) is shown for patient 9 (bottom, the horizontal projection). [Color figure can be viewed in the online issue, which is available at http://wileyonlinelibrary.com.]
Figure 4
Figure 4
Distribution of activating, receiving, and bidirectional connections. A–D: Average values of AR‐index for mainly activator or receiver contacts and the percentage of activator and receiver contacts for phase 1 (A and B) and phase 2 (C and D) in EZ (black columns), EPZ (gray columns), and healthy tissue (white columns), calculated in 12 patients. Values from each patient are illustrated by light gray lines. E: Quantification of the average number of bidirectional connections in EZ and EPZ normalized to the mean number of bidirectional connection of the contacts in healthy tissue calculated for phase 1 (left) and phase 2 (right panel). F: Percentage of bidirectional connections in EZ and EPZ calculated for phase 1 (left) and phase 2 (right panel). The value of normalized bidirectionality and percentage beside the absolute number of mean bidirectional contacts from each patient are reported in Supporting Information Figure 1. G: The total activation is the summation of activated and activating contacts for each stimulated contact, minus the number of bidirectional connections, averaged with respect to the pathological and healthy regions. The absence of any statistical significance in this parameter let us reject the hypothesis of a bias on the activator or receptor behavior of each contact due to a higher number of activated/activating contacts.
Figure 5
Figure 5
A: Schema of the recording contacts inside the brain of patient 9; in red the contacts in the EZ and in yellow the ones in the EPZ. B: Two‐dimensional connectivity maps based on the stimulated/activated contacts. Map of contact connectivity during phases 1 and 2 in patient 9, based on the analysis of averaged SPES‐evoked responses. Separation between contacts was optimized using a force‐directed layout [Fruchterman and Reingold, 1991]. Connections (light blue) with marked directions (see enlargement of B11 contact) originate from stimulated contacts and end on supra‐threshold activated contacts. Purple lines represent bidirectional relationships between couples of contacts. EZ contacts (reported in red) are clustered separately from the EPZ contacts (in yellow) in this patient. Bridging links connect the two main groups of contacts both maps. The two main groups of contacts of phase 1 and 2 maps are all included in temporal lobe (upper and right groups in phase 1 and 2, respectively) and in frontal lobe (lower and right groups in phase 1 and 2, respectively). For phase 1, contacts interposed between the two groups represented intermediate structures between the two lobes: contacts R2 to R9 were located in the central operculum and contacts B9‐B11 in the medium temporal gyrus.
Figure 6
Figure 6
Clustering of contacts analysed by connectivity features. ClusterONE network‐clustering algorithm was applied to phase 1 connectivity 2D‐map in the same patient 9 of Figure 5, to identify optimal clusters of contacts (in purple) sharing dense connection patterns. The contacts belonging to each cluster were also reported, with the same colour (on the side of each connectivity map), in the brain schema of the implanted electrodes of the patient. Red and yellow dots in the connectivity maps identify the EZ and the EPZ. The location of the clusters (purple contacts) in the 3D reconstruction of the patient brain is shown on the right in each panel. Cluster overlapping was permitted. A: Cluster matching with the EZ. B and C: Clusters included in the EPZ. D: Cluster matching with well‐defined anatomical and functional healthy tissue structures that connect the temporal with the frontal lobe (opercular region).
Figure 7
Figure 7
Distribution of contact clusters. A: Mean number of contacts in EZ (black column), EPZ (gray column), and healthy tissue (white column) clusters during phases 1 and 2 calculate in all 12 patients. B: Number of bidirectional connections in EZ, EPZ, and healthy tissue clusters. C: Ratios between bidirectional and unidirectional connections for the two phases. D: Cluster quality feature comparison between EZ, EPZ, and healthy tissue clusters. Quality parameter represents a measure of cohesiveness, which assesses a well‐defined cluster with many internal edges and few boundary edges. One‐sided Mann‐Whitney U test was used to determine the significance: ***= P <0,001; ** = P <0,01; *= P <0,05.

References

    1. Alivisatos AP, Chun M, Church GM, Greenspan RJ, Roukes ML, Yuste R (2012) The brain activity map project and the challenge of functional connectomics. Neuron 74:970–974. - PMC - PubMed
    1. Andrzejak RG, Mormann F, Widman G, Kreuz T, Elger CE, Lehnertz K (2006): Improved spatial characterization of the epileptic brain by focusing on nonlinearity. Epilepsy Res 69:30–44. - PubMed
    1. Bartolomei, F , Wendling, F , Regis, J , Gavaret, M , Guye, M , Chauvel, P (2004): Pre‐ictal synchronicity in limbic networks of mesial temporal lobe epilepsy. Epilepsy Res 61:89–104. - PubMed
    1. Bartolomei F, Chauvel P, Wendling F (2008): Epileptogenicity of brain structures in human temporal lobe epilepsy: Aa quantified study from intracerebral EEG. Brain 131:1818–1830. - PubMed
    1. Biella G, Panzica F, de Curtis M (1996): Interactions between associative synaptic potentials in the piriform cortex of the in vitro isolated guinea pig brain. Eur J Neurosci 8:1350–1357. - PubMed

Publication types

MeSH terms

LinkOut - more resources