

doi: 10.1093/ije/dyu080.
Epub 2014 Apr 4.
What is the difference between missing completely at random and missing at random?
Affiliations
- PMID: 24706730
- PMCID: PMC4121561
- DOI: 10.1093/ije/dyu080
Item in Clipboard
What is the difference between missing completely at random and missing at random?
Int J Epidemiol.
2014 Aug.
Abstract
The terminology describing missingness mechanisms is confusing. In particular the meaning of 'missing at random' is often misunderstood, leading researchers faced with missing data problems away from multiple imputation, a method with considerable advantages. The purpose of this article is to clarify how 'missing at random' differs from 'missing completely at random' via an imagined dialogue between a clinical researcher and statistician.
Keywords: missing at random; missing data; multiple imputation.
© The Author 2014; all rights reserved. Published by Oxford University Press on behalf of the International Epidemiological Association.
Figures
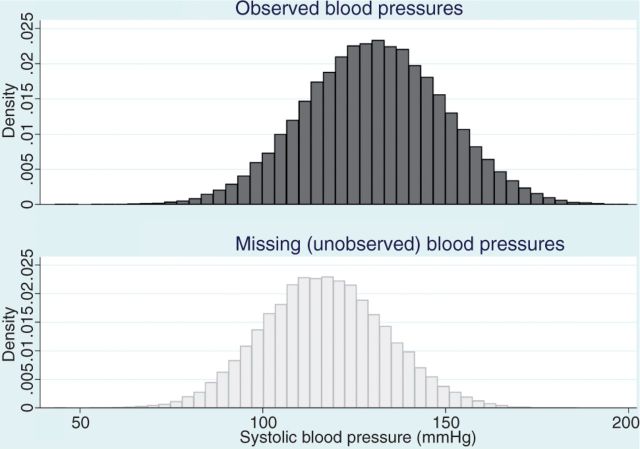
Distribution of systolic blood pressure (simulated data) comparing those with blood pressure recorded (top panel) and those with blood pressure missing (bottom panel)—blood pressure is missing at random conditional on age and cardiovascular disease. Simulated data with 100 000 observations, divided into two age groups (young, elderly) and with a randomly assigned binary cardiovascular disease (CVD) variable. Among those with no CVD, mean systolic blood pressure (SBP) was set at 110 mmHg in the young age group, 120 mmHg in the elderly. Mean SPB was set 15 mmHg higher where CVD was present. Individual normally distributed observations were simulated with standard deviation 15 mmHg. The probability of SBP being missing was 0.8 in the young age group with no CVD, 0.4 in the young age group with CVD, 0.2 in the elderly with no CVD and 0.1 in the elderly with CVD
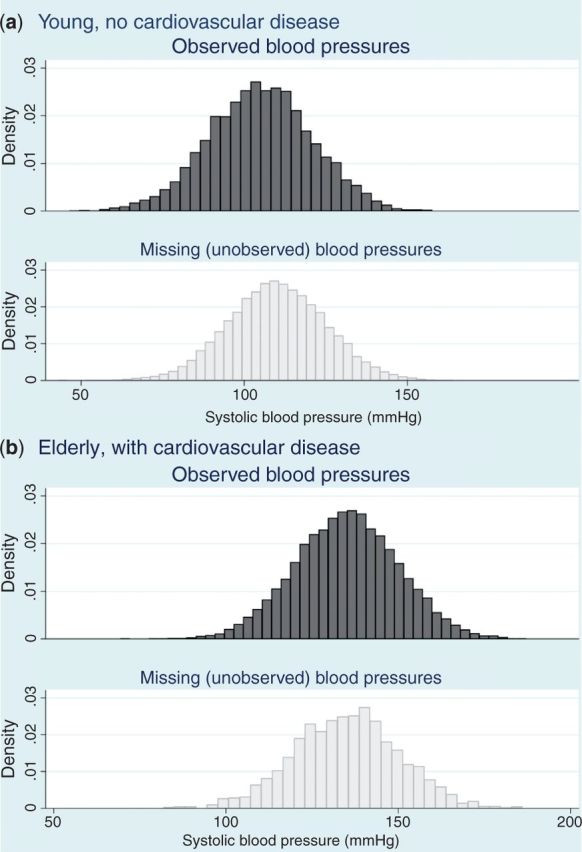
Distribution of systolic blood pressure comparing those with blood pressure recorded and those with blood pressure missing, within age/cardiovascular disease strata (simulated data) –—blood pressure is missing at random conditional on age and cardiovascular disease. Generated from the same simulated dataset as described in the footnote to Figure 1
References
-
- Carpenter J, Kenward M. Multiple Imputation and its Application. Chichester, UK: John Wiley & Sons, 2012.
-
- Rubin DB. Multiple Imputation for Nonresponse in Surveys. New York: Wiley, 1987.
-
- Greenland S, Finkle WD. A critical look at methods for handling missing covariates in epidemiologic regression analyses. Am J Epidemiol 1995;142:1255–64. - PubMed
Publication types
MeSH terms
Grants and funding
LinkOut - more resources
Full Text Sources
Other Literature Sources
