

Molecular mechanism for differential recognition of membrane phosphatidylserine by the immune regulatory receptor Tim4
- PMID: 24706780
- PMCID: PMC3992656
- DOI: 10.1073/pnas.1320174111
Molecular mechanism for differential recognition of membrane phosphatidylserine by the immune regulatory receptor Tim4
Abstract
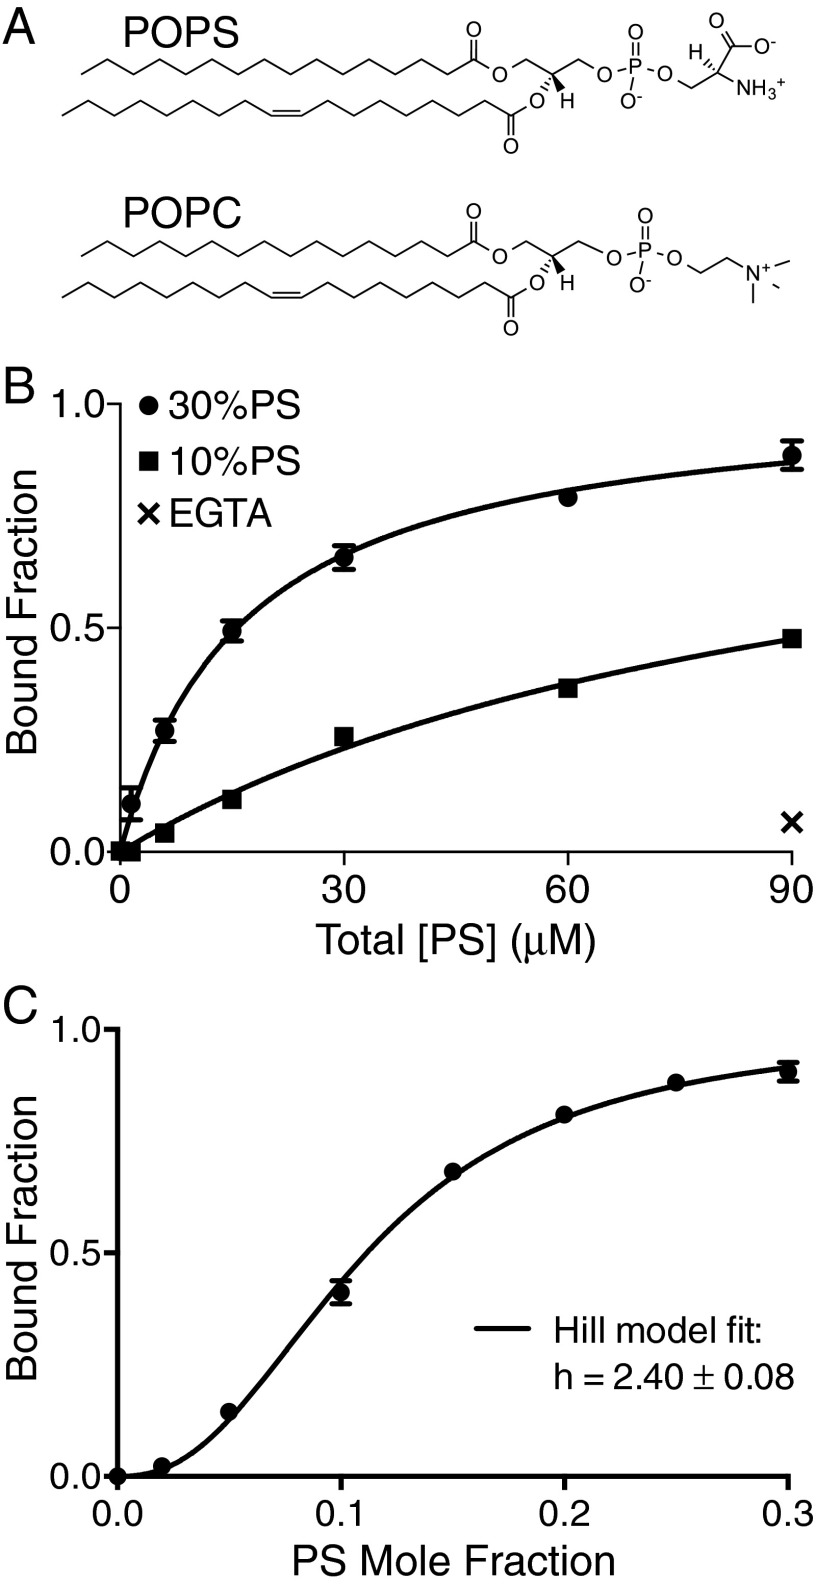
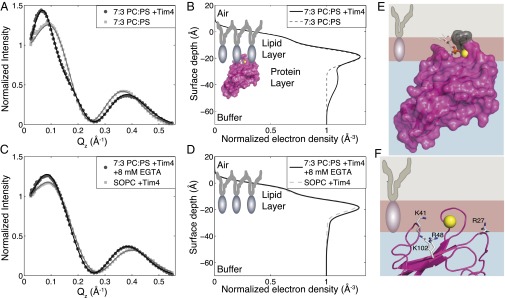
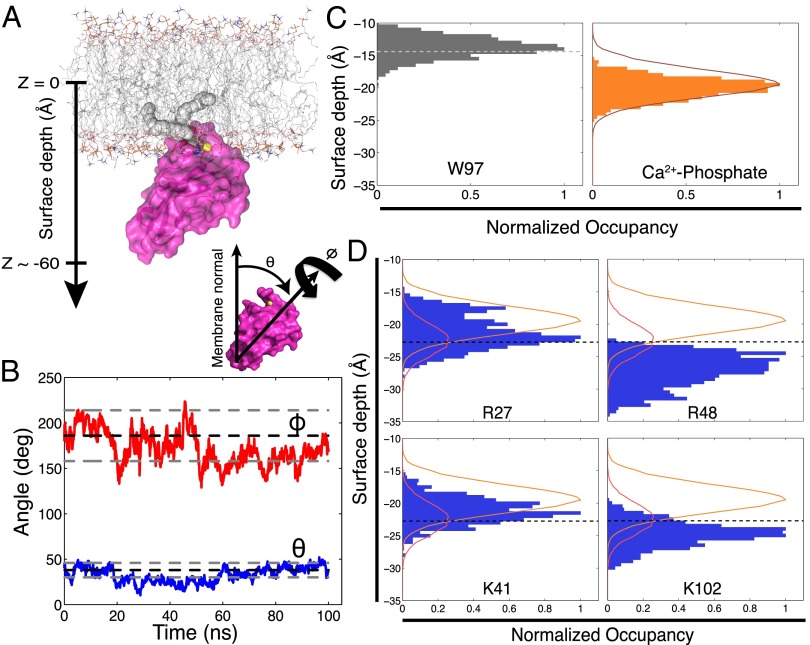
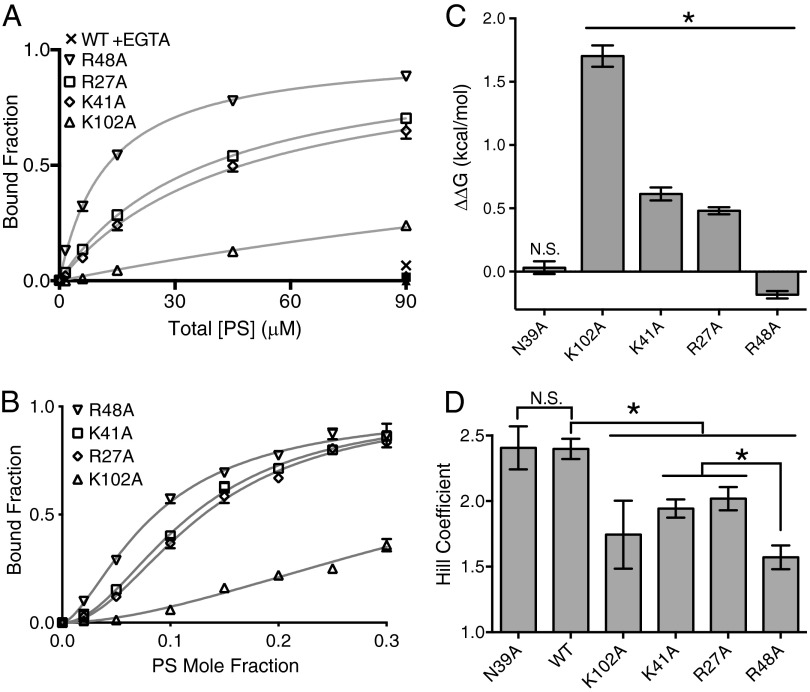
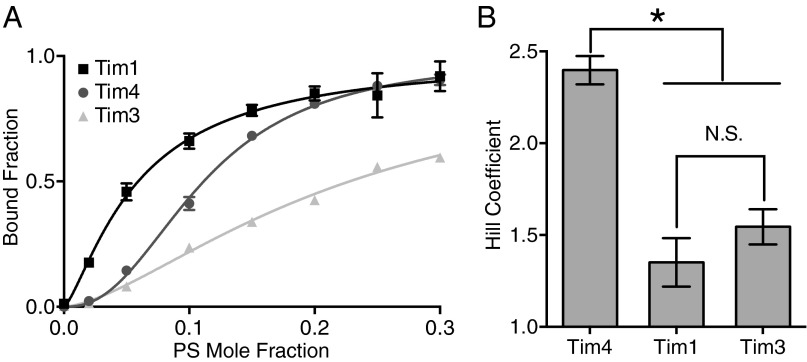
Recognition of phosphatidylserine (PS) lipids exposed on the extracellular leaflet of plasma membranes is implicated in both apoptotic cell removal and immune regulation. The PS receptor T cell immunoglobulin and mucin-domain-containing molecule 4 (Tim4) regulates T-cell immunity via phagocytosis of both apoptotic (high PS exposure) and nonapoptotic (intermediate PS exposure) activated T cells. The latter population must be removed at lower efficiency to sensitively control immune tolerance and memory cell population size, but the molecular basis for how Tim4 achieves this sensitivity is unknown. Using a combination of interfacial X-ray scattering, molecular dynamics simulations, and membrane binding assays, we demonstrate how Tim4 recognizes PS in the context of a lipid bilayer. Our data reveal that in addition to the known Ca(2+)-coordinated, single-PS binding pocket, Tim4 has four weaker sites of potential ionic interactions with PS lipids. This organization makes Tim4 sensitive to PS surface concentration in a manner capable of supporting differential recognition on the basis of PS exposure level. The structurally homologous, but functionally distinct, Tim1 and Tim3 are significantly less sensitive to PS surface density, likely reflecting the differences in immunological function between the Tim proteins. These results establish the potential for lipid membrane parameters, such as PS surface density, to play a critical role in facilitating selective recognition of PS-exposing cells. Furthermore, our multidisciplinary approach overcomes the difficulties associated with characterizing dynamic protein/membrane systems to reveal the molecular mechanisms underlying Tim4's recognition properties, and thereby provides an approach capable of providing atomic-level detail to uncover the nuances of protein/membrane interactions.
Keywords: PS recognition; differential membrane recognition.
Conflict of interest statement
The authors declare no conflict of interest.
Figures
Similar articles
-
Coupling X-Ray Reflectivity and In Silico Binding to Yield Dynamics of Membrane Recognition by Tim1.Biophys J. 2017 Oct 3;113(7):1505-1519. doi: 10.1016/j.bpj.2017.08.003. Biophys J. 2017. PMID: 28978444 Free PMC article.
-
How Tim proteins differentially exploit membrane features to attain robust target sensitivity.Biophys J. 2021 Nov 2;120(21):4891-4902. doi: 10.1016/j.bpj.2021.09.016. Epub 2021 Sep 14. Biophys J. 2021. PMID: 34529946 Free PMC article.
-
Sensitivity of peripheral membrane proteins to the membrane context: A case study of phosphatidylserine and the TIM proteins.Biochim Biophys Acta Biomembr. 2018 Oct;1860(10):2126-2133. doi: 10.1016/j.bbamem.2018.06.010. Epub 2018 Jun 18. Biochim Biophys Acta Biomembr. 2018. PMID: 29920237 Free PMC article. Review.
-
Glioma-derived T cell immunoglobulin- and mucin domain-containing molecule-4 (TIM4) contributes to tumor tolerance.J Biol Chem. 2011 Oct 21;286(42):36694-9. doi: 10.1074/jbc.M111.292540. Epub 2011 Sep 6. J Biol Chem. 2011. PMID: 21896488 Free PMC article.
-
Diverse roles of TIM4 in immune activation: implications for alloimmunity.Curr Opin Organ Transplant. 2018 Feb;23(1):44-50. doi: 10.1097/MOT.0000000000000487. Curr Opin Organ Transplant. 2018. PMID: 29189411 Review.
Cited by
-
Remodeling articular immune homeostasis with an efferocytosis-informed nanoimitator mitigates rheumatoid arthritis in mice.Nat Commun. 2023 Feb 13;14(1):817. doi: 10.1038/s41467-023-36468-2. Nat Commun. 2023. PMID: 36781864 Free PMC article.
-
Tolerogenic form of Factor VIII to prevent inhibitor development in the treatment of Hemophilia A.J Thromb Haemost. 2021 Nov;19(11):2744-2750. doi: 10.1111/jth.15497. Epub 2021 Sep 1. J Thromb Haemost. 2021. PMID: 34390536 Free PMC article.
-
Biological Function and Immunotherapy Utilizing Phosphatidylserine-based Nanoparticles.Immunol Invest. 2020 Oct;49(7):858-874. doi: 10.1080/08820139.2020.1738456. Epub 2020 Mar 23. Immunol Invest. 2020. PMID: 32204629 Free PMC article. Review.
-
Phosphatidylserine receptors: enhancers of enveloped virus entry and infection.Virology. 2014 Nov;468-470:565-580. doi: 10.1016/j.virol.2014.09.009. Epub 2014 Sep 29. Virology. 2014. PMID: 25277499 Free PMC article. Review.
-
Coupling X-Ray Reflectivity and In Silico Binding to Yield Dynamics of Membrane Recognition by Tim1.Biophys J. 2017 Oct 3;113(7):1505-1519. doi: 10.1016/j.bpj.2017.08.003. Biophys J. 2017. PMID: 28978444 Free PMC article.
References
-
- Fischer K, et al. Antigen recognition induces phosphatidylserine exposure on the cell surface of human CD8+ T cells. Blood. 2006;108(13):4094–4101. - PubMed
-
- Dillon SR, Constantinescu A, Schlissel MS. Annexin V binds to positively selected B cells. J Immunol. 2001;166(1):58–71. - PubMed
-
- Dillon SR, Mancini M, Rosen A, Schlissel MS. Annexin V binds to viable B cells and colocalizes with a marker of lipid rafts upon B cell receptor activation. J Immunol. 2000;164(3):1322–1332. - PubMed
Publication types
MeSH terms
Substances
Grants and funding
LinkOut - more resources
Full Text Sources
Other Literature Sources
Molecular Biology Databases
Research Materials
Miscellaneous
