

Global and time-resolved monitoring of crop photosynthesis with chlorophyll fluorescence
- PMID: 24706867
- PMCID: PMC3986187
- DOI: 10.1073/pnas.1320008111
Global and time-resolved monitoring of crop photosynthesis with chlorophyll fluorescence
Abstract
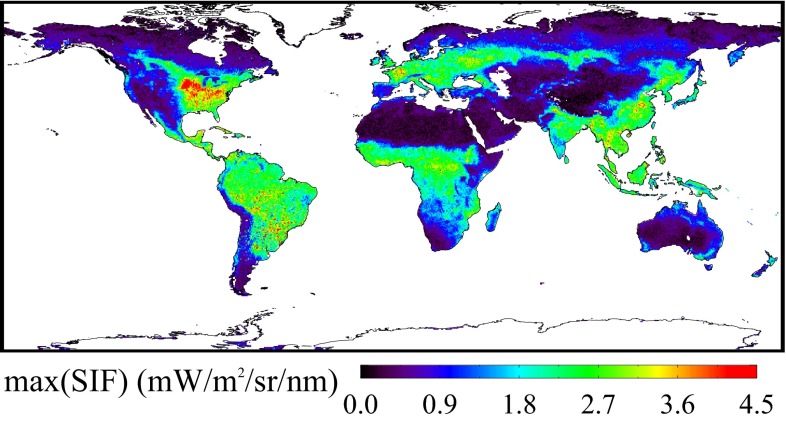
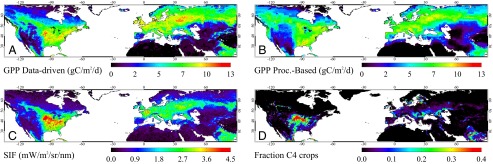
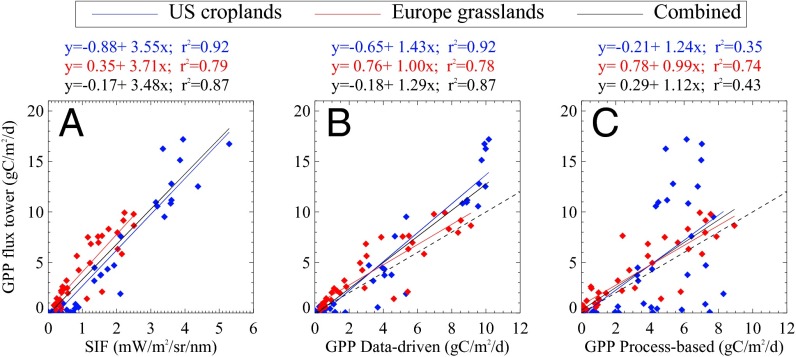
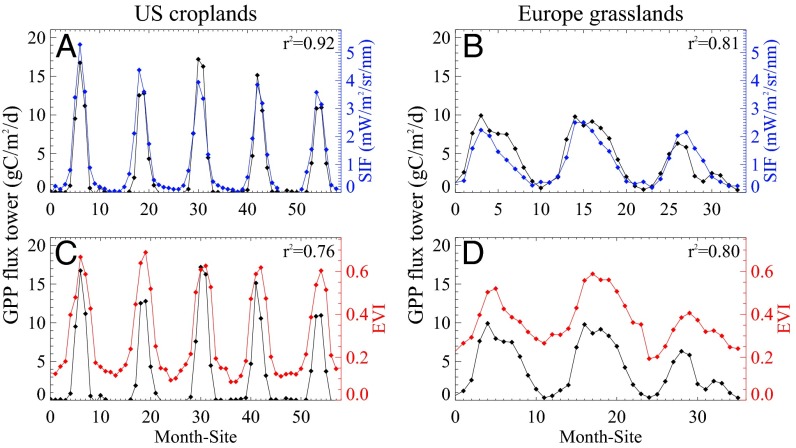
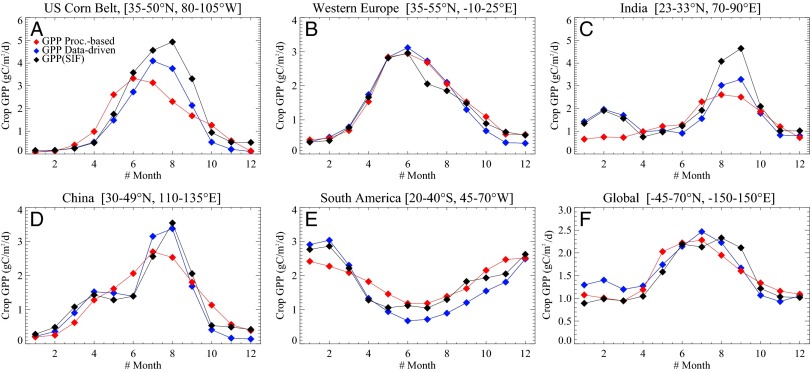
Photosynthesis is the process by which plants harvest sunlight to produce sugars from carbon dioxide and water. It is the primary source of energy for all life on Earth; hence it is important to understand how this process responds to climate change and human impact. However, model-based estimates of gross primary production (GPP, output from photosynthesis) are highly uncertain, in particular over heavily managed agricultural areas. Recent advances in spectroscopy enable the space-based monitoring of sun-induced chlorophyll fluorescence (SIF) from terrestrial plants. Here we demonstrate that spaceborne SIF retrievals provide a direct measure of the GPP of cropland and grassland ecosystems. Such a strong link with crop photosynthesis is not evident for traditional remotely sensed vegetation indices, nor for more complex carbon cycle models. We use SIF observations to provide a global perspective on agricultural productivity. Our SIF-based crop GPP estimates are 50-75% higher than results from state-of-the-art carbon cycle models over, for example, the US Corn Belt and the Indo-Gangetic Plain, implying that current models severely underestimate the role of management. Our results indicate that SIF data can help us improve our global models for more accurate projections of agricultural productivity and climate impact on crop yields. Extension of our approach to other ecosystems, along with increased observational capabilities for SIF in the near future, holds the prospect of reducing uncertainties in the modeling of the current and future carbon cycle.
Keywords: Earth observation; carbon fluxes; carbon modeling; crop productivity; spaceborne spectroscopy.
Conflict of interest statement
The authors declare no conflict of interest.
Figures
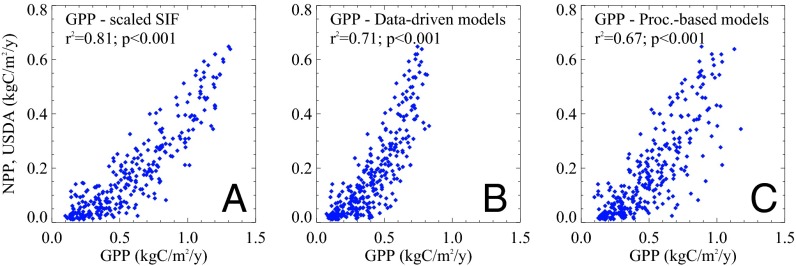
 and the P value of the comparisons are shown. An analogous comparison with the inventory-based NPP from Monfreda et al. (7), which also includes Western Europe, can be found in
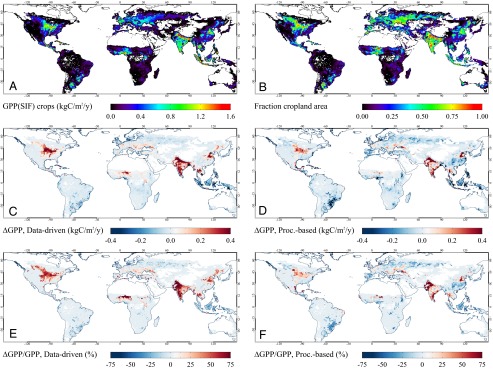
Comment in
-
Let's exploit available knowledge on vegetation fluorescence.Proc Natl Acad Sci U S A. 2014 Jun 24;111(25):E2510. doi: 10.1073/pnas.1406600111. Epub 2014 Jun 3. Proc Natl Acad Sci U S A. 2014. PMID: 24927587 Free PMC article. No abstract available.
-
Reply to Magnani et al.: Linking large-scale chlorophyll fluorescence observations with cropland gross primary production.Proc Natl Acad Sci U S A. 2014 Jun 24;111(25):E2511. doi: 10.1073/pnas.1406996111. Proc Natl Acad Sci U S A. 2014. PMID: 25093229 Free PMC article. No abstract available.
References
-
- Foley JA, et al. Solutions for a cultivated planet. Nature. 2011;478(7369):337–342. - PubMed
-
- Wheeler T, von Braun J. Climate change impacts on global food security. Science. 2013;341(6145):508–513. - PubMed
-
- Battisti DS, Naylor RL. Historical warnings of future food insecurity with unprecedented seasonal heat. Science. 2009;323(5911):240–244. - PubMed
-
- Lobell DB, et al. The critical role of extreme heat for maize production in the United States. Nat Clim Change. 2013;3(5):497–501.
Publication types
MeSH terms
Substances
LinkOut - more resources
Full Text Sources
Other Literature Sources
Research Materials
