. 2014 Apr 8;111(14):5289-94.
doi: 10.1073/pnas.1312717110. Epub 2014 Mar 27.

Differential roles of epigenetic changes and Foxp3 expression in regulatory T cell-specific transcriptional regulation

Collaborators, Affiliations

Differential roles of epigenetic changes and Foxp3 expression in regulatory T cell-specific transcriptional regulation

Hiromasa Morikawa et al. Proc Natl Acad Sci U S A. .

Abstract

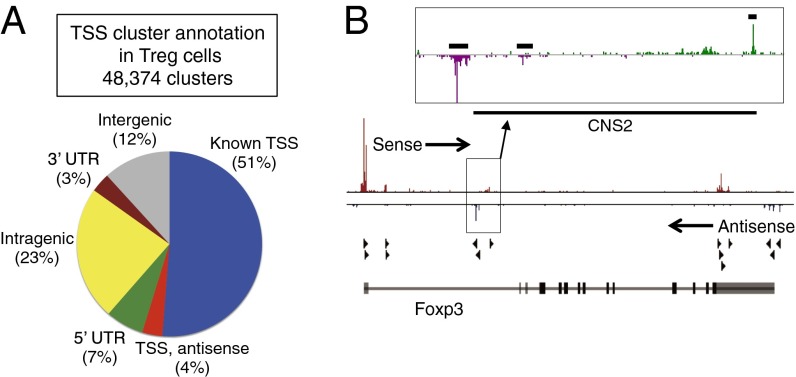
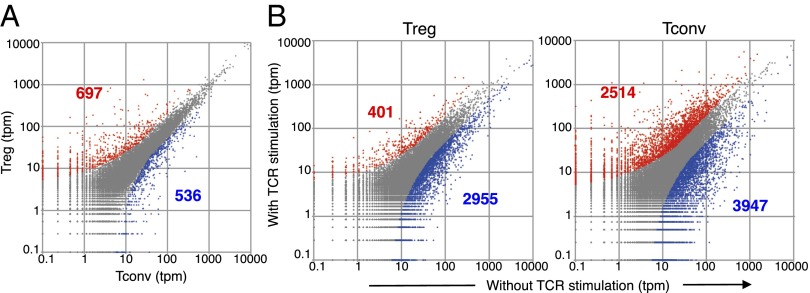
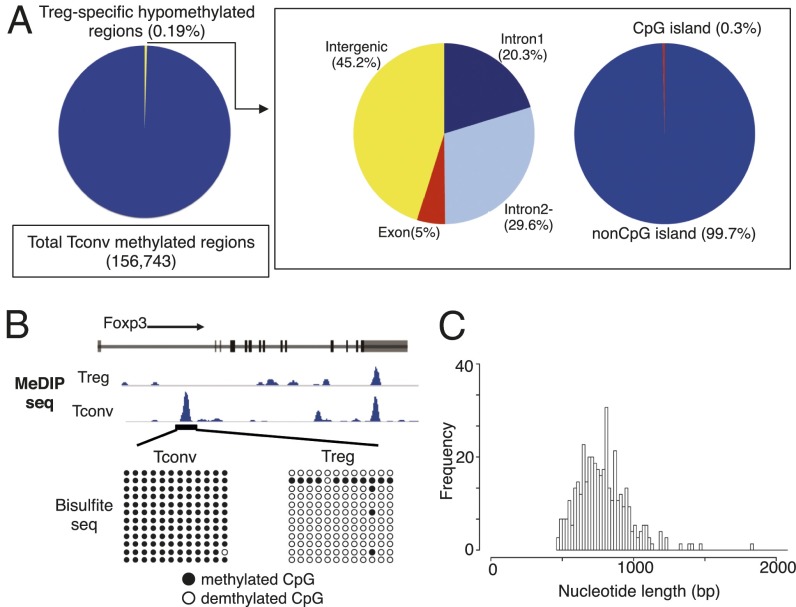
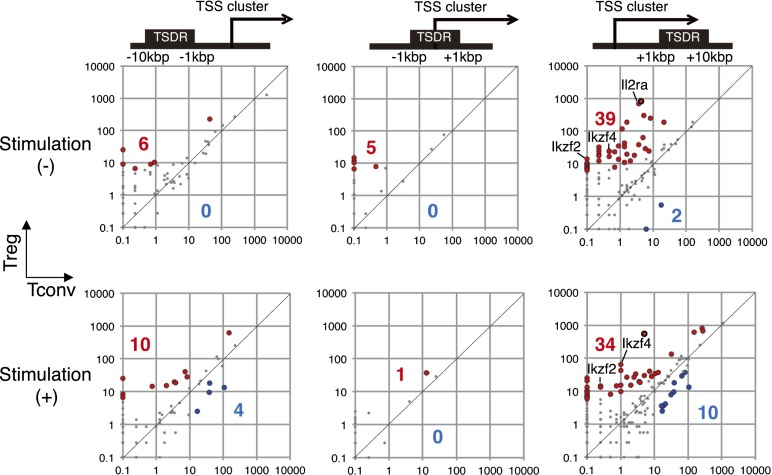
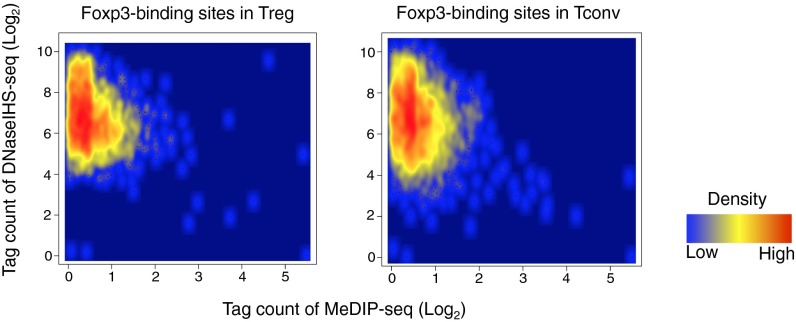
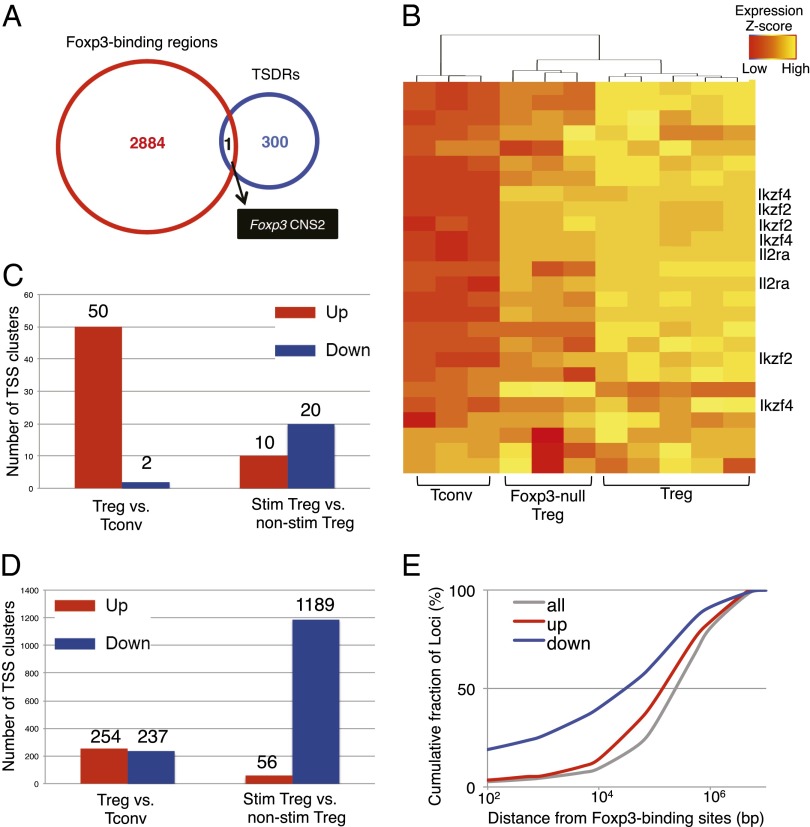
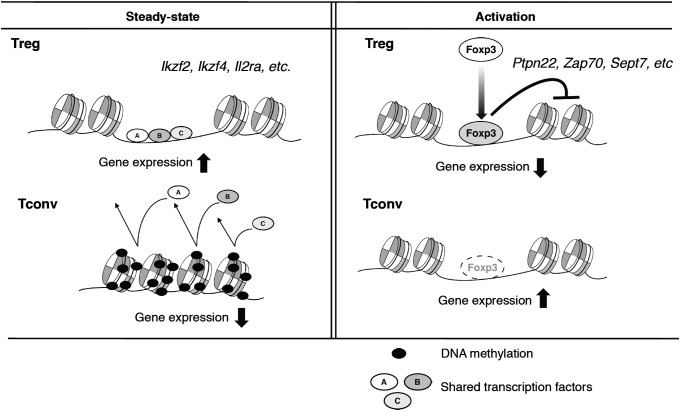
Naturally occurring regulatory T (Treg) cells, which specifically express the transcription factor forkhead box P3 (Foxp3), are engaged in the maintenance of immunological self-tolerance and homeostasis. By transcriptional start site cluster analysis, we assessed here how genome-wide patterns of DNA methylation or Foxp3 binding sites were associated with Treg-specific gene expression. We found that Treg-specific DNA hypomethylated regions were closely associated with Treg up-regulated transcriptional start site clusters, whereas Foxp3 binding regions had no significant correlation with either up- or down-regulated clusters in nonactivated Treg cells. However, in activated Treg cells, Foxp3 binding regions showed a strong correlation with down-regulated clusters. In accordance with these findings, the above two features of activation-dependent gene regulation in Treg cells tend to occur at different locations in the genome. The results collectively indicate that Treg-specific DNA hypomethylation is instrumental in gene up-regulation in steady state Treg cells, whereas Foxp3 down-regulates the expression of its target genes in activated Treg cells. Thus, the two events seem to play distinct but complementary roles in Treg-specific gene expression.


Conflict of interest statement

The authors declare no conflict of interest.

Figures

Fig. 1.
Fig. 1.
TSS clusters identified in Treg cells. (A) Annotation of TSS clusters identified in Treg cells. (B) TSS clusters of the Foxp3 locus. Upper and lower peaks show CAGE tags originating from the sense and antisense strands, respectively. Arrowheads indicate robust TSS clusters defined in the FANTOM5 work in ref. . Upper shows the magnification of the Foxp3 CNS2 locus. TSS locations determined by FANTOM5 are indicated by horizontal lines.
Fig. 2.
Fig. 2.
Different transcriptional regulation between Treg and Tconv cells. (A) Comparison of TSS cluster expression between Tconv (x axis) and Treg (y axis) cells. Red and blue dots indicate significantly up- or down-regulated TSS clusters in Treg cells, respectively; tpm represents tags per million tags. (B) Significantly up- (red) or down-regulated (blue) TSS clusters after TCR stimulation in (Left) Treg or (Right) Tconv cells; x and y axes indicate TSS cluster expression before and after TCR stimulation, respectively.
Fig. 3.
Fig. 3.
Treg-specific DNA hypomethylated regions. (A) The ratio of TSDRs within total DNA methylation peaks of Tconv cells determined by MeDIP-seq and MACS. Center and Right show the annotation of TSDRs regarding location and association with CpG island. (B) DNA methylation pattern of the Foxp3 locus by MeDIP-seq. Confirmations of the differences by bisulfite sequencing are shown below. Black and open circles indicate methylated and unmethylated CpG residues, respectively. Each column represents each CpG residue in the Foxp3 CNS2 region. (C) Histogram of the length of TSDRs.
Fig. 4.
Fig. 4.
Correlation of TSDRs with TSS clusters up-regulated in steady state Treg cells. Expression profiles of TSS clusters sorted by positional relation to TSDRs. Red and blue dots indicate significantly up- or down-regulated TSS clusters in Treg cells, respectively. Upper and Lower show expression profiles without and with TCR stimulation, respectively.
Fig. 5.
Fig. 5.
Similarity in the chromatin status of Foxp3 binding sites. Heat maps show normalized tag counts of MeDIP-seq (x axis) and DNaseI-HS-seq (y axis) within 500 bp from Foxp3 binding sites of Treg cells in (Left) Treg and (Right) Tconv cells.
Fig. 6.
Fig. 6.
TSDRs and Foxp3 distinctly contribute to Treg-specific gene regulation. (A) Venn diagram illustrating the lack of commonality between genomic regions of Foxp3 binding sites and TSDRs. (B) Gene expression profiles were compared among Tconv, Treg, and Foxp3-null Treg cells (20). Shown are the profiles of genes associated with TSS clusters that located within 10 kbp of TSDRs and showed up-regulation in Treg cells compared with Tconv cells. (C) Distribution of TSS clusters located within 10 kbp of TSDRs. (D) Distribution of TSS clusters locating within 10 kbp of Foxp3 binding sites. Samples of activated Treg cells were obtained from Treg cells stimulated with anti-CD3 and -CD28 antibodies for 6 h. (E) Cumulative distribution of TSS clusters within 1-Mbp regions from Foxp3 binding sites. Blue and red lines indicate TSS clusters significantly down- and up-regulated in Treg cells after TCR stimulation, respectively. Cumulative distribution of all TSS clusters is also shown as a negative control (gray line).
Fig. 7.
Fig. 7.
Models of Treg-specific gene regulation by chromatin structures and transcription factors. Both chromatin structures and transcription factors coordinately regulate Treg-specific gene expression. Under the steady state, Treg-specific gene regulations are mainly dependent on chromatin structures specifically established in Treg cells. In contrast, under activated conditions, Foxp3 becomes functional and contributes to the gene regulation, especially to the repression of its target genes.

References

    1. Sakaguchi S, Yamaguchi T, Nomura T, Ono M. Regulatory T cells and immune tolerance. Cell. 2008;133(5):775–787. - PubMed
    1. Hori S, Nomura T, Sakaguchi S. Control of regulatory T cell development by the transcription factor Foxp3. Science. 2003;299(5609):1057–1061. - PubMed
    1. Fontenot JD, Gavin MA, Rudensky AY. Foxp3 programs the development and function of CD4+CD25+ regulatory T cells. Nat Immunol. 2003;4(4):330–336. - PubMed
    1. Khattri R, Cox T, Yasayko SA, Ramsdell F. An essential role for Scurfin in CD4+CD25+ T regulatory cells. Nat Immunol. 2003;4(4):337–342. - PubMed
    1. Bennett CL, et al. The immune dysregulation, polyendocrinopathy, enteropathy, X-linked syndrome (IPEX) is caused by mutations of FOXP3. Nat Genet. 2001;27(1):20–21. - PubMed

Publication types

Substances

LinkOut - more resources