. 2014 Jun 15;127(Pt 12):2672-82.
doi: 10.1242/jcs.140558. Epub 2014 Apr 4.

GAS2-like proteins mediate communication between microtubules and actin through interactions with end-binding proteins

Affiliations

GAS2-like proteins mediate communication between microtubules and actin through interactions with end-binding proteins

Matthew J Stroud et al. J Cell Sci. .

Abstract

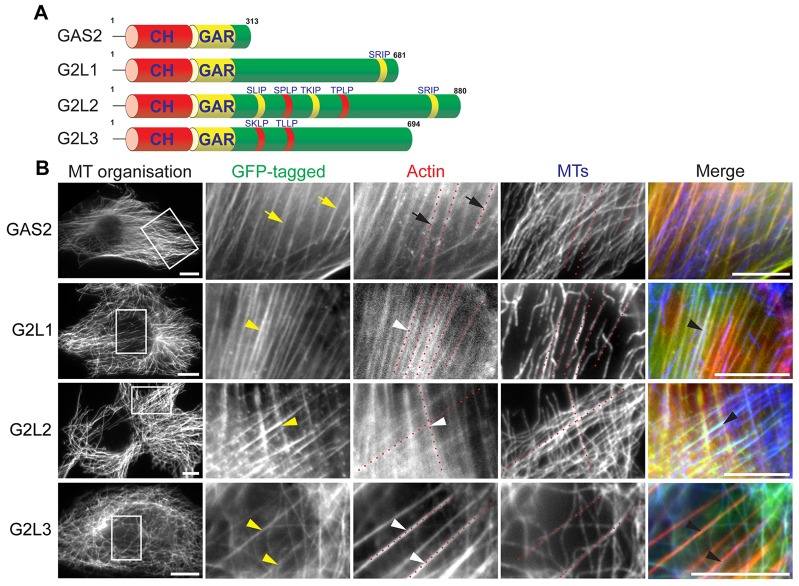
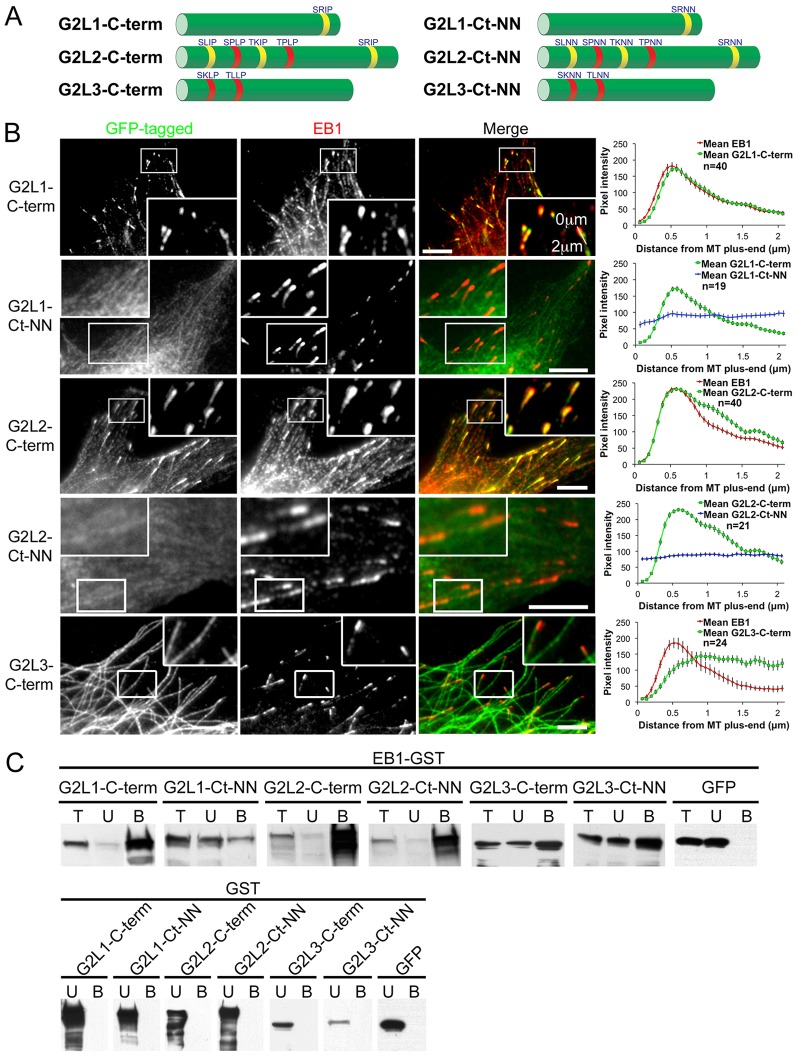
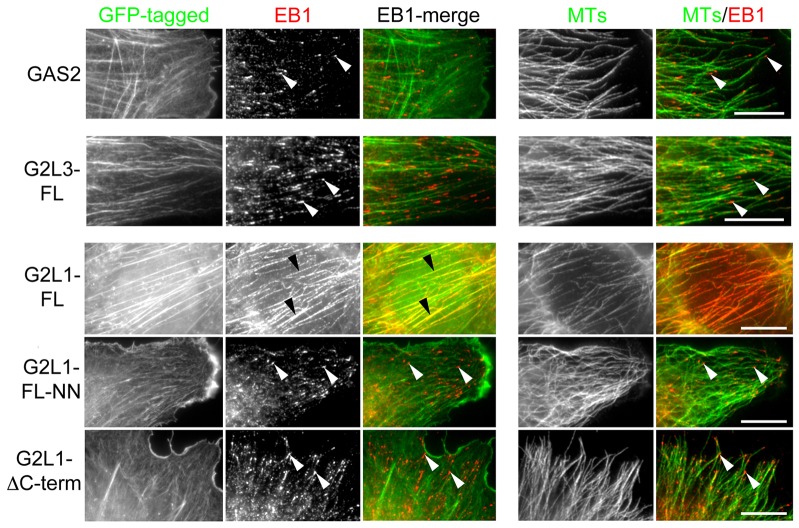
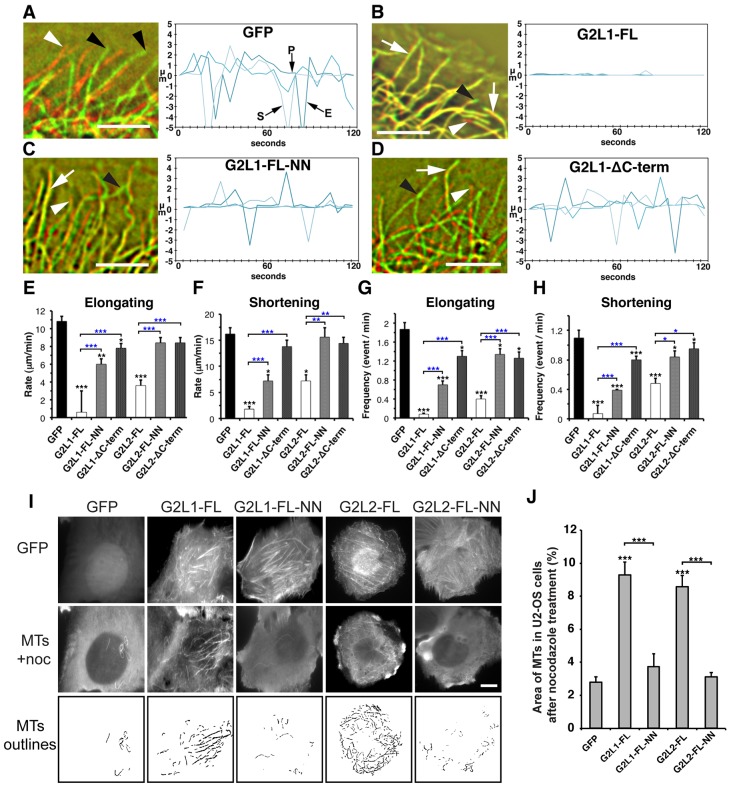
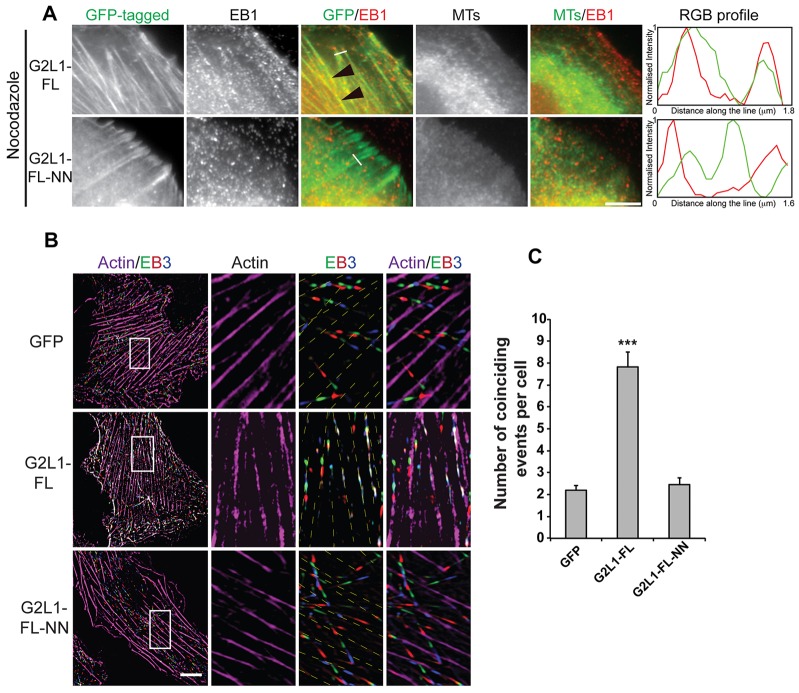
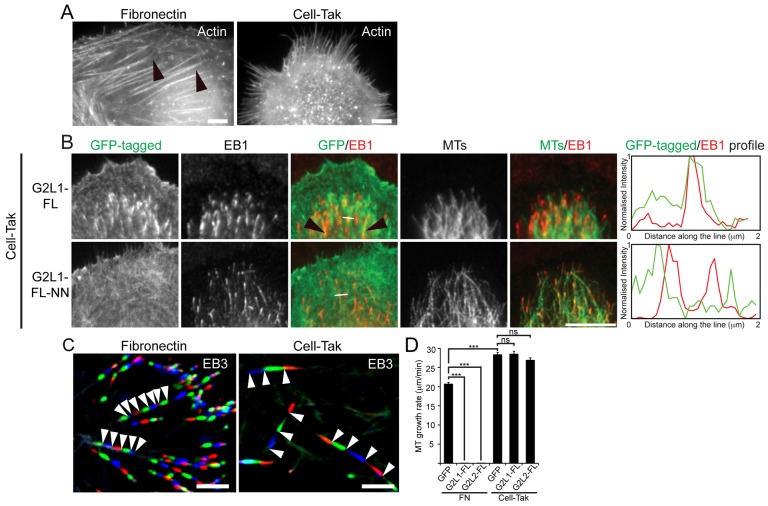
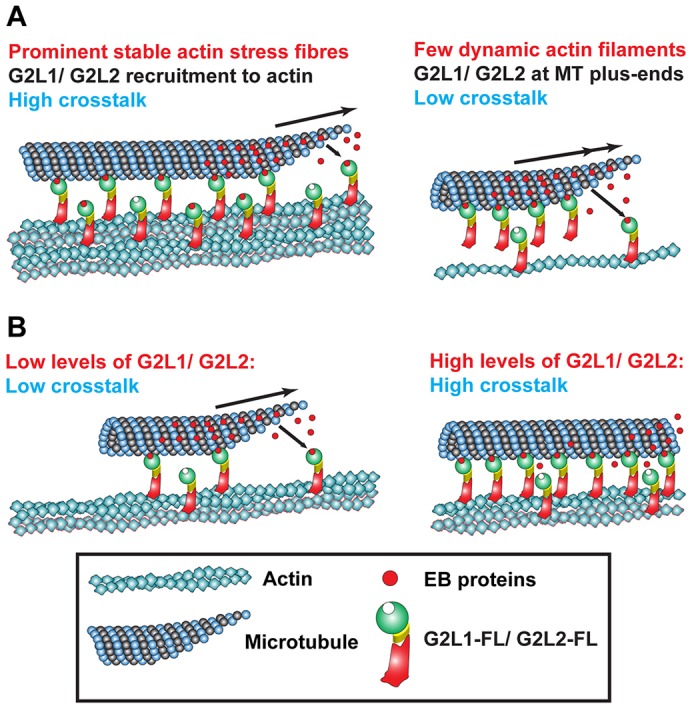
Crosstalk between the microtubule (MT) and actin cytoskeletons is fundamental to many cellular processes including cell polarisation and cell motility. Previous work has shown that members of the growth-arrest-specific 2 (GAS2) family mediate the crosstalk between filamentous actin (F-actin) and MTs, but the molecular basis of this process remained unclear. By using fluorescence microscopy, we demonstrate that three members of this family, GAS2-like 1, GAS2-like 2 and GAS2-like 3 (G2L1, G2L2 and G2L3, also known as GAS2L1, GAS2L2 and GAS2L3, respectively) are differentially involved in mediating the crosstalk between F-actin and MTs. Although all localise to actin and MTs, only the exogenous expression of G2L1 and G2L2 influenced MT stability, dynamics and guidance along actin stress fibres. Biochemical analysis and live-cell imaging revealed that their functions are largely due to the association of these proteins with MT plus-end-binding proteins that bind to SxIP or SxLP motifs located at G2L C-termini. Our findings lead to a model in which end-binding (EB) proteins play a key role in mediating actin-MT crosstalk.

Keywords: Actin; End-binding protein; GAS2 family; GAS2-like 1; GAS2-like 2; GAS2-like 3; MT-tip localising signal; Microtubule; MtLS.


Figures

Fig. 1.
Fig. 1.
Subcellular localisation of the GAS2 family members. (A) Schematic representation of members of the GAS2 family. The calponin homology (CH) and GAS2-related (GAR) domains are depicted in red and yellow, respectively, and the number of amino acids for each family member is noted above the C-termini. The sequences of the MtLSs are denoted above their respective C-termini, SxIP motifs are yellow, S/TxLP motifs are red. Note that the β-isoforms of G2L1 and G2L2 are depicted. (B) NIH3T3 cells expressing the indicated constructs were fixed and stained for MTs and actin. Dotted red lines indicate where the actin cytoskeleton is in respect to the MTs. Note that GAS2 (yellow arrows) localised exclusively to the actin cytoskeleton (black arrows), whereas G2L1, G2L2 and G2L3 (yellow arrowheads) localised to both MTs (black arrowheads) and actin-rich structures (white arrowheads). Scale bars: 10 µm.
Fig. 2.
Fig. 2.
MtLSs in GAS2-like proteins are essential for plus-end localisation and augment their binding to EB1. (A) Schematic representation of the C-termini of the GAS2-like proteins used in this study, with their MtLSs indicated (left panel), and their respective mutants in which the isoleucine/leucine-proline (I/L-P) residues have been mutated to two asparagine residues (NN) (right panel). Note that G2L1 contains one MtLS, and G2L2 and G2L3 contain five and two MtLSs, respectively. The sequences of the MtLSs are denoted above their respective C-termini, SxIP motifs are yellow, S/TxLP motifs are red. (B) NIH3T3 cells expressing the indicated constructs were fixed and stained for EB1. Lines were drawn from the end of the MT plus-end through the MT towards the cell interior (as indicated in G2L1-C-term inset), and pixel intensities were recorded for both EB1 and the indicated construct (right panel). Note that the G2L1-C-term and G2L2-C-term colocalised with EB1 decorating MT plus-ends. Conversely, G2L1-Ct-NN and G2L2-Ct-NN mutants localised along the MT lattice. G2L3-C-term localises along the microtubule lattice. Rectangular regions of interest are enlarged in each panel. The number of MT plus-ends scored is given; results are mean±s.e.m. Scale bars: 5 µm. (C) COS1 cells expressing the indicated GFP-tagged construct were lysed and incubated with GST–EB1 (top panel) or GST (control)-coated glutathione beads (lower panel). The total cell lysate (T), unbound (U) and bound (B) fractions were taken and immunoblotted using an anti-GFP antibody. Note that G2L1-C-term, G2L2-C-term and G2L3-C-term all bind strongly to EB1, in comparison to their respective mutants, which bind more weakly. GST-coated control beads do not interact with any of the G2L family members, as they are not found in the bound fractions.
Fig. 3.
Fig. 3.
G2L1 recruits EB proteins along the actin cytoskeleton. NIH3T3 cells expressing GAS2, G2L3 or G2L1 were fixed and stained for EB1 and MTs. Note the G2L1 colocalisation with EB1 at the actin cytoskeleton (black arrowheads). MtLS mutations (FL-NN) or deletion of the C-terminus (ΔC-term) restore EB1 localisation to MT plus-ends (white arrowheads). GAS2 and G2L3 do not affect the localisation of EB1 (white arrowheads). Scale bars: 5 µm.
Fig. 4.
Fig. 4.
G2L1 and G2L2 regulate MT dynamics and stabilise MTs through their interaction with EBs. (A–D) To visualise MT dynamics the first and the last image of a 2-min time-lapse recording of mCherry–tubulin-expressing U2OS cells co-expressing the indicated constructs were labelled in red and green, respectively, and then superimposed. Structures that remained at the same place during the recording appear yellow (white arrows); elongation events appear green (black arrowheads) and shortening events are red (white arrowheads). Note that MT elongation and shortening events are strongly reduced upon co-expression of G2L1-FL, whereas co-expression of G2L1-FL-NN or G2L1-ΔC-term had only minor effects on MT dynamics. MT-lifetime history plots from three representative MTs outline shortening (S), elongating (E), and pausing (P) events of MTs in the GFP control (A). Scale bars: 5 µm. (E,F) Quantification of MT elongation and shortening rates upon expression of indicated G2L1, and G2L2 constructs. (G,H) Frequency of MT elongation and shortening events for the indicated G2L1 and G2L2 constructs. Note that expression of G2L1, and G2L2 significantly decreased the rate and frequency of both shortening and elongation. Blocking the interaction between of G2L1 and G2L2 with EBs through MtLS mutations or C-terminal deletions rescued MT dynamics to a great extent. Results are mean±s.e.m. *P<0.05; **P<0.01; ***P<0.001 (black asterisks indicate significance according to the Student's t-test when compared to GFP; blue asterisks indicate significance according to the Student's t-test between the indicated constructs). (I) U2OS cells expressing the indicated G2L constructs were treated with nocodazole, then fixed and stained for MTs. Note the increase of nocodazole-resistant MTs in cells expressing G2L1-FL and G2L2-FL compared to their respective EB-binding defective mutants and GFP control. Scale bar: 10 µm. (J) Graph represents quantification of I, where the percentage of the cell area containing MTs was measured in cells expressing G2L constructs after nocodazole treatment.
Fig. 5.
Fig. 5.
G2L1 localising on actin stress fibres guides MTs in an EB-dependent manner. U2OS cells expressing the indicated constructs were treated with nocodazole (A). Note that in contrast to G2L1-FL-NN, G2L1 was able to retain EB1 at actin stress fibres independently of MTs (black arrowheads). Scale bar: 5 µm. The white line indicates the position of the RGB profile shown to the right. (B) Still frames from movies taken of NIH 3T3 cells expressing G2L1-FL or G2L1-FL-NN or GFP together with EB3 (green, red, blue) and actin (magenta). Magnifications indicate localisation of EB3 (merge of three consecutive time frames taken every 5 s) and actin stress fibres. Note that EB3 was guided along actin stress fibres in G2L1-FL-transfected cells. This phenomenon was no longer observed in cells expressing the EB-binding-defective mutant G2L1-FL-NN. Scale bar: 10 µm. (C) Graph represents quantification of B where co-alignment of three consecutive time frames of EB3 along actin stress fibres was considered as one coincidence event.
Fig. 6.
Fig. 6.
The effect of G2L proteins on MT dynamics is dependent on the extracellular matrix. (A) CHO-K1 cells expressing GFP were plated on either fibronectin (left panel) or Cell-Tak (right panel), and actin was visualised with either phalloidin or Lifeact–RFP. Note the absence of prominent actin stress fibres in cells plated on Cell-Tak in comparison to fibronectin (black arrowheads). (B) U2OS cells expressing the indicated constructs plated on Cell-Tak. Note that G2L1 was present on fine actin structures, but predominantly localised to EB1-positive MT plus-ends (black arrowheads), whereas the EB-binding-defective mutant (G2L1-FL-NN) predominantly localised to actin. White lines indicate regions taken for intensity profile measurements shown to the right. (C) CHO-K1 cells expressing EB3–tdTomato were plated either on fibronectin or Cell-Tak and time-lapse images were recorded in 5-s intervals. Consecutive frames of EB3 displayed in red, green and blue, were superimposed to visualise MT growth over time. The decrease in distance between red, green and blue MT tips in cells plated on fibronectin versus cells on Cell-Tak outlines the impact of actin organisation on MT dynamics (white arrowheads). (D) Quantification of MT growth speed measured by plus-end-tip displacement of cells expressing indicated constructs (n = 165 MT plus-ends from >5 cells per condition). Note the reduction of MT growth rates on fibronectin (FN) and the failure of G2L1 and G2L2 to stabilise MT when plated on Cell-Tak. ***P<0.001; ns, not significant (P>0.1), according to the Student's t-test between indicated constructs. Scale bars: 5 µm.
Fig. 7.
Fig. 7.
Model of G2L-mediated crosstalk. (A) G2L1 and G2L2 act as sensors and detect actin structures that require crosstalk with MTs. (B) Changes in requirements of crosstalk in the cell might be regulated either by modulating their endogenous expression levels or by changing the binding strength to actin or EBs.

References

    1. Alves-Silva J., Sanchez-Soriano N., Beaven R., Klein M., Parkin J., Millard T. H., Bellen H. J., Venken K. J., Ballestrem C., Kammerer R. A. et al. (2012). Spectraplakins promote microtubule-mediated axonal growth by functioning as structural microtubule-associated proteins and EB1-dependent +TIPs (tip interacting proteins). J. Neurosci. 32, 9143–9158 - PMC - PubMed
    1. Applewhite D. A., Grode K. D., Keller D., Zadeh A., Slep K. C., Rogers S. L. (2010). The spectraplakin Short stop is an actin-microtubule cross-linker that contributes to organization of the microtubule network. Mol. Biol. Cell 21, 1714–1724 10.1006/mcne.1995.0003 - DOI - PMC - PubMed
    1. Bernier G., Brown A., Dalpé G., De Repentigny Y., Mathieu M., Kothary R. (1995). Dystonin expression in the developing nervous system predominates in the neurons that degenerate in dystonia musculorum mutant mice. Mol. Cell. Neurosci. 6, 509–520 10.1006/mcne.1995.0003 - DOI - PubMed
    1. Brancolini C., Schneider C. (1994). Phosphorylation of the growth arrest-specific protein Gas2 is coupled to actin rearrangements during Go→G1 transition in NIH 3T3 cells. J. Cell Biol. 124, 743–756 10.1083/jcb.124.5.743 - DOI - PMC - PubMed
    1. Brancolini C., Bottega S., Schneider C. (1992). Gas2, a growth arrest-specific protein, is a component of the microfilament network system. J. Cell Biol. 117, 1251–1261 10.1083/jcb.117.6.1251 - DOI - PMC - PubMed

Publication types