

Mapping protein conformational heterogeneity under pressure with site-directed spin labeling and double electron-electron resonance
- PMID: 24707053
- PMCID: PMC3977274
- DOI: 10.1073/pnas.1403179111
Mapping protein conformational heterogeneity under pressure with site-directed spin labeling and double electron-electron resonance
Abstract
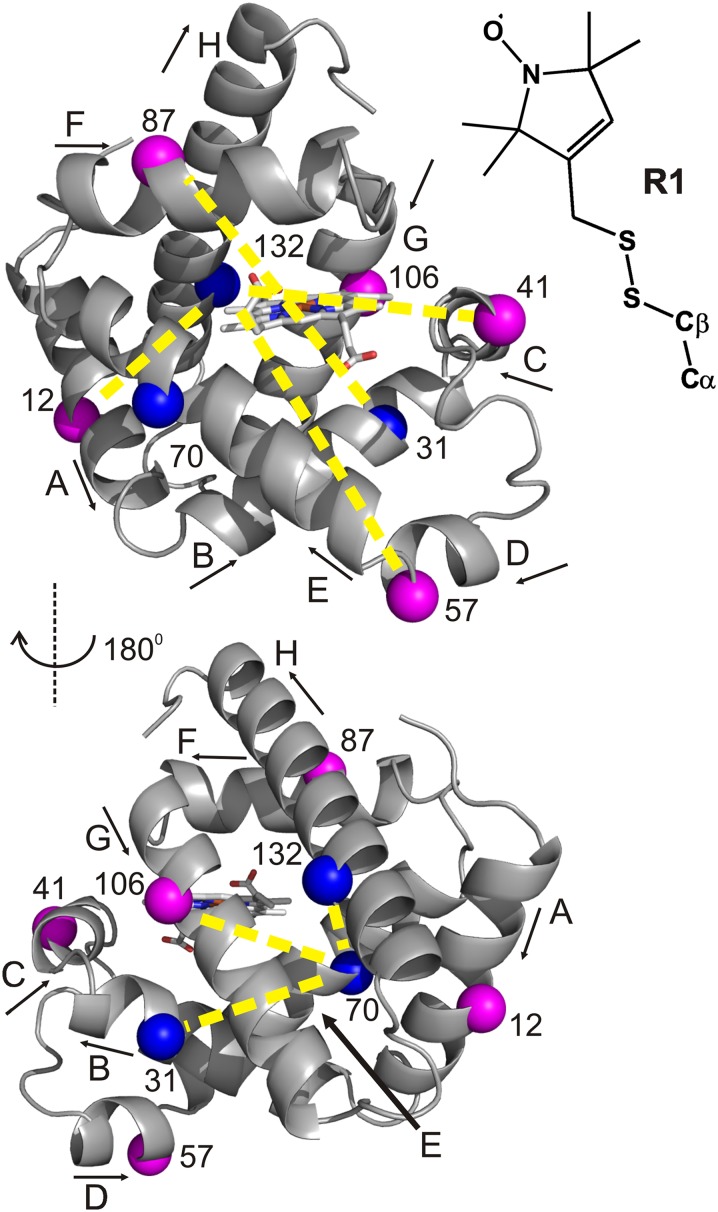
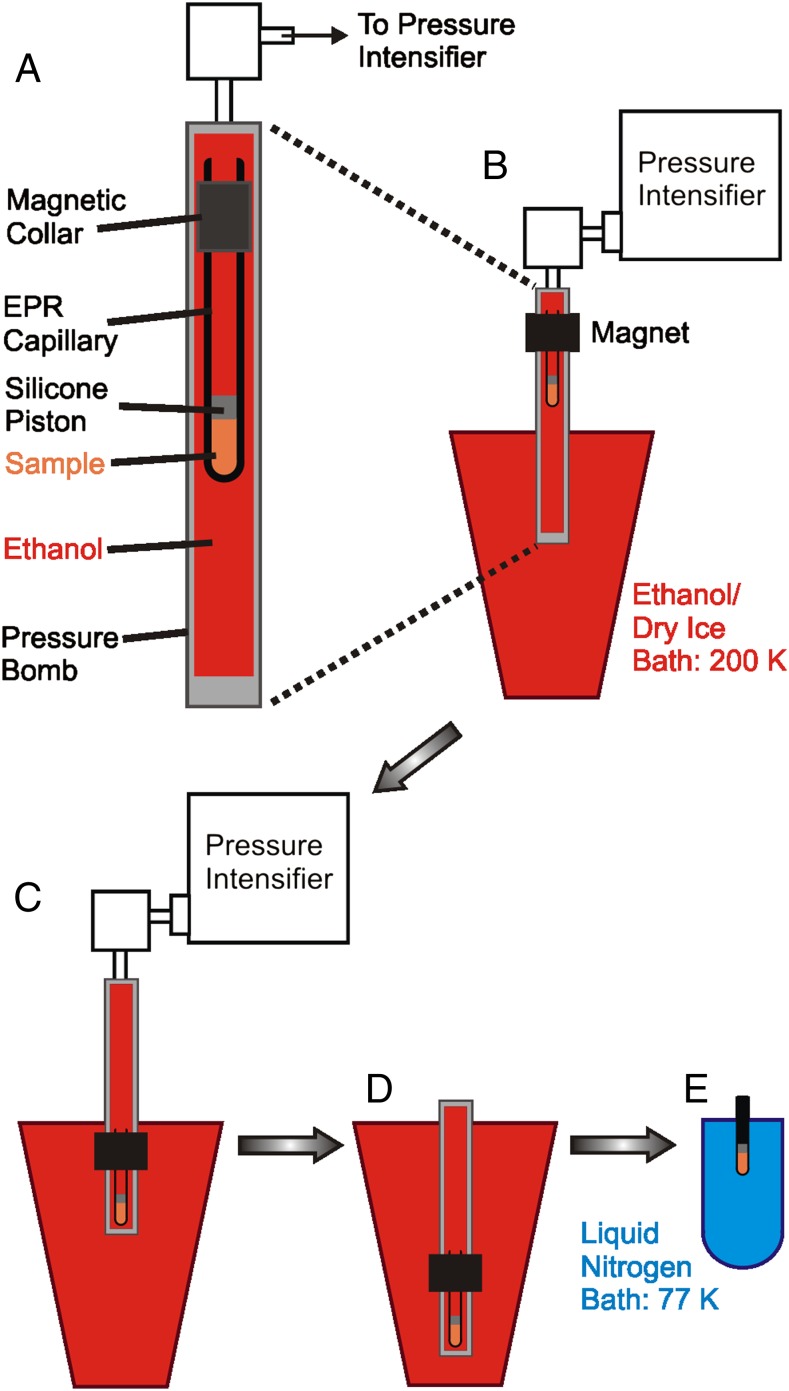
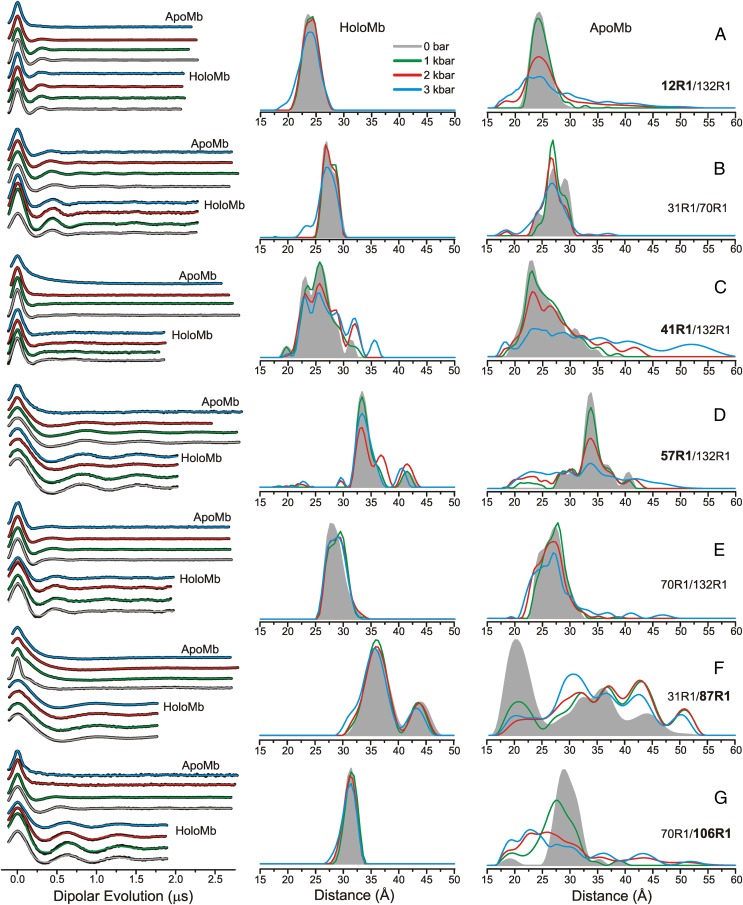
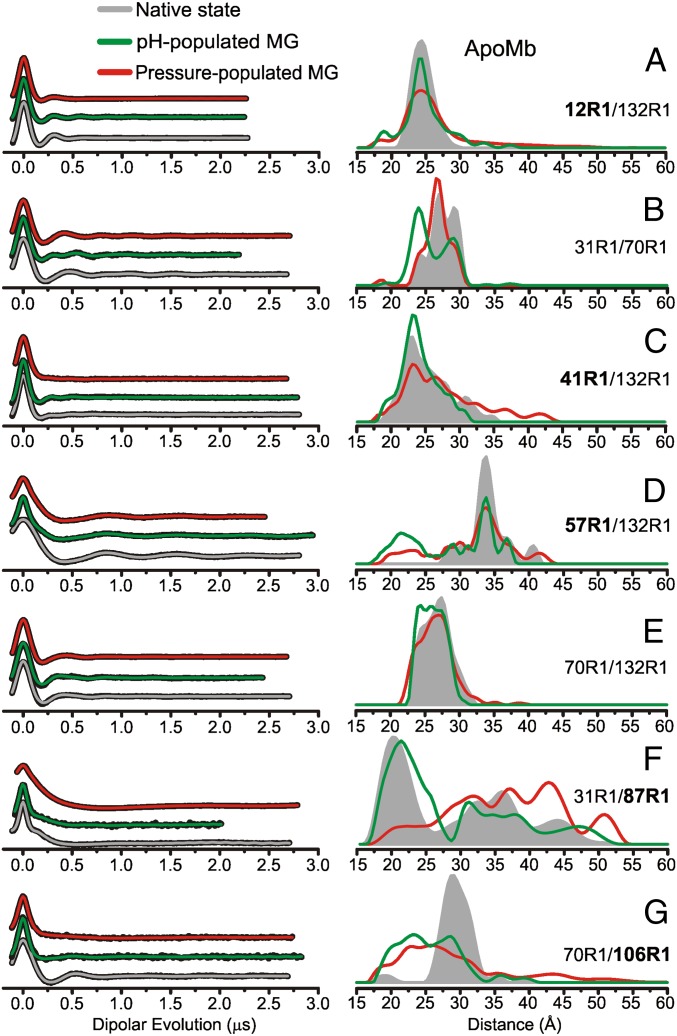
The dominance of a single native state for most proteins under ambient conditions belies the functional importance of higher-energy conformational states (excited states), which often are too sparsely populated to allow spectroscopic investigation. Application of high hydrostatic pressure increases the population of excited states for study, but structural characterization is not trivial because of the multiplicity of states in the ensemble and rapid (microsecond to millisecond) exchange between them. Site-directed spin labeling in combination with double electron-electron resonance (DEER) provides long-range (20-80 Å) distance distributions with angstrom-level resolution and thus is ideally suited to resolve conformational heterogeneity in an excited state populated under high pressure. DEER currently is performed at cryogenic temperatures. Therefore, a method was developed for rapidly freezing spin-labeled proteins under pressure to kinetically trap the high-pressure conformational ensemble for subsequent DEER data collection at atmospheric pressure. The methodology was evaluated using seven doubly-labeled mutants of myoglobin designed to monitor selected interhelical distances. For holomyoglobin, the distance distributions are narrow and relatively insensitive to pressure. In apomyoglobin, on the other hand, the distributions reveal a striking conformational heterogeneity involving specific helices in the pressure range of 0-3 kbar, where a molten globule state is formed. The data directly reveal the amplitude of helical fluctuations, information unique to the DEER method that complements previous rate determinations. Comparison of the distance distributions for pressure- and pH-populated molten globules shows them to be remarkably similar despite a lower helical content in the latter.
Keywords: EPR; compressibility; dipolar spectroscopy.
Conflict of interest statement
The authors declare no conflict of interest.
Figures
Similar articles
-
Circular dichroism and site-directed spin labeling reveal structural and dynamical features of high-pressure states of myoglobin.Proc Natl Acad Sci U S A. 2013 Dec 3;110(49):E4714-22. doi: 10.1073/pnas.1320124110. Epub 2013 Nov 18. Proc Natl Acad Sci U S A. 2013. PMID: 24248390 Free PMC article.
-
High-Pressure EPR and Site-Directed Spin Labeling for Mapping Molecular Flexibility in Proteins.Methods Enzymol. 2015;564:29-57. doi: 10.1016/bs.mie.2015.07.004. Epub 2015 Sep 9. Methods Enzymol. 2015. PMID: 26477247
-
Site-specific hydration dynamics in the nonpolar core of a molten globule by dynamic nuclear polarization of water.J Am Chem Soc. 2011 Apr 20;133(15):5987-95. doi: 10.1021/ja111515s. Epub 2011 Mar 28. J Am Chem Soc. 2011. PMID: 21443207 Free PMC article.
-
Protein Modeling with DEER Spectroscopy.Annu Rev Biophys. 2025 May;54(1):35-57. doi: 10.1146/annurev-biophys-030524-013431. Epub 2024 Dec 17. Annu Rev Biophys. 2025. PMID: 39689263 Free PMC article. Review.
-
Identifying and quantitating conformational exchange in membrane proteins using site-directed spin labeling.Acc Chem Res. 2014 Oct 21;47(10):3102-9. doi: 10.1021/ar500228s. Epub 2014 Aug 25. Acc Chem Res. 2014. PMID: 25152957 Free PMC article. Review.
Cited by
-
Biophysical and Biochemical Characterization of Avian Secretory Component Provides Structural Insights into the Evolution of the Polymeric Ig Receptor.J Immunol. 2016 Aug 15;197(4):1408-14. doi: 10.4049/jimmunol.1600463. Epub 2016 Jul 13. J Immunol. 2016. PMID: 27412418 Free PMC article.
-
Hydraulic Activation of the AsLOV2 photoreceptor.bioRxiv [Preprint]. 2025 Jun 25:2025.06.19.660617. doi: 10.1101/2025.06.19.660617. bioRxiv. 2025. PMID: 40667302 Free PMC article. Preprint.
-
Long-range distance measurements in proteins at physiological temperatures using saturation recovery EPR spectroscopy.J Am Chem Soc. 2014 Oct 29;136(43):15356-65. doi: 10.1021/ja5083206. Epub 2014 Oct 17. J Am Chem Soc. 2014. PMID: 25290172 Free PMC article.
-
Coherent pump pulses in Double Electron Electron Resonance spectroscopy.Phys Chem Chem Phys. 2016 Jul 21;18(27):18470-85. doi: 10.1039/c6cp03555h. Epub 2016 Jun 24. Phys Chem Chem Phys. 2016. PMID: 27339858 Free PMC article.
-
Structure-relaxation mechanism for the response of T4 lysozyme cavity mutants to hydrostatic pressure.Proc Natl Acad Sci U S A. 2015 May 12;112(19):E2437-46. doi: 10.1073/pnas.1506505112. Epub 2015 Apr 27. Proc Natl Acad Sci U S A. 2015. PMID: 25918400 Free PMC article.
References
-
- Baldwin AJ, Kay LE. NMR spectroscopy brings invisible protein states into focus. Nat Chem Biol. 2009;5(11):808–814. - PubMed
-
- Henzler-Wildman K, Kern D. Dynamic personalities of proteins. Nature. 2007;450(7172):964–972. - PubMed
-
- Kitahara R, et al. High pressure NMR reveals active-site hinge motion of folate-bound Escherichia coli dihydrofolate reductase. Biochemistry. 2000;39(42):12789–12795. - PubMed
-
- Kitahara R, Yokoyama S, Akasaka K. NMR snapshots of a fluctuating protein structure: Ubiquitin at 30 bar-3 kbar. J Mol Biol. 2005;347(2):277–285. - PubMed
Publication types
MeSH terms
Substances
Grants and funding
LinkOut - more resources
Full Text Sources
Other Literature Sources
