

Identification and Imaging of 15N Labeled Cells with ToF-SIMS
- PMID: 24707066
- PMCID: PMC3975616
- DOI: 10.1002/sia.3679
Identification and Imaging of 15N Labeled Cells with ToF-SIMS
Abstract
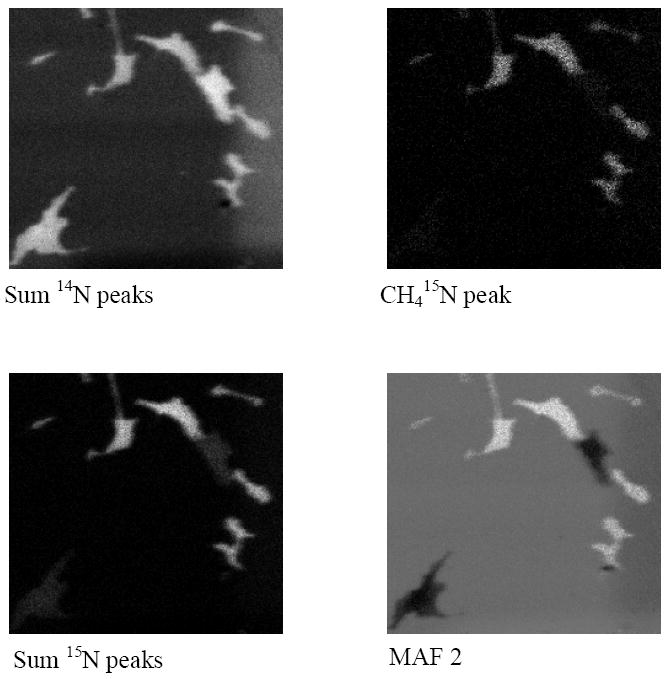
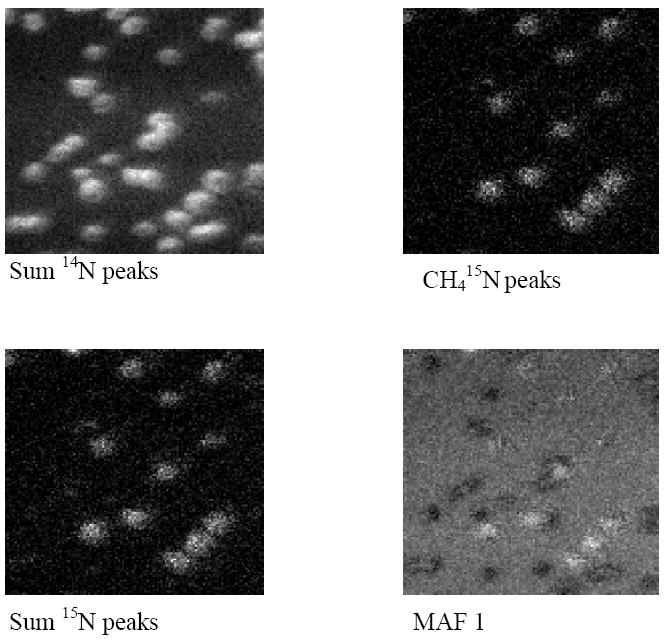
Stable isotope labeling may provide a novel method for tracking stem cells once they have been injected into a human or animal host. Here we present a simple pilot study to determine the potential for using ToF-SIMS to detect and localize 15N labeled cells in tissue biopsies for use in cell therapy studies. For this pilot study, 3T3 fibroblasts were grown in normal media and in two different media containing 15N labeled amino acids. Samples containing a mixture of 15N labeled and unlabeled cells were prepared, fixed and dried for analysis and were then imaged using a bunched Bi3+ primary ion source. The cells containing 15N labeled amino acids could be readily distinguished using nitrogen containing peaks which have been previously associated with the labeled amino acids. Contrast was sufficient to allow easy identification of labeled cells in both sparsely and densely plated cultures. Multivariate analysis showed that the image contrast could be improved by including peaks originating from characteristic fragments of the labeled amino acids as well as lower mass NH4+ and CH4N+ peaks. Additional work is being pursued to determine and improve the longevity of the label.
Figures
Similar articles
-
Enhanced TOF-SIMS imaging of a micropatterned protein by stable isotope protein labeling.Anal Chem. 2001 Jan 15;73(2):143-50. doi: 10.1021/ac000771l. Anal Chem. 2001. PMID: 11199958
-
Identifying individual cell types in heterogeneous cultures using secondary ion mass spectrometry imaging with C60 etching and multivariate analysis.Anal Chem. 2012 Jan 17;84(2):893-900. doi: 10.1021/ac201179t. Epub 2012 Jan 3. Anal Chem. 2012. PMID: 22098081 Free PMC article.
-
Identifying the characteristic secondary ions of lignin polymer using ToF-SIMS.Biomacromolecules. 2005 Mar-Apr;6(2):678-83. doi: 10.1021/bm049521v. Biomacromolecules. 2005. PMID: 15762629
-
Chemical characterisation of different separation media based on agarose by static time-of-flight secondary ion mass spectrometry.J Chromatogr A. 2004 Jan 9;1023(1):49-56. doi: 10.1016/j.chroma.2003.10.008. J Chromatogr A. 2004. PMID: 14760849
-
FluidMAG iron nanoparticle-labeled mesenchymal stem cells for tracking cell homing to tumors.2009 Dec 23 [updated 2010 Feb 16]. In: Molecular Imaging and Contrast Agent Database (MICAD) [Internet]. Bethesda (MD): National Center for Biotechnology Information (US); 2004–2013. 2009 Dec 23 [updated 2010 Feb 16]. In: Molecular Imaging and Contrast Agent Database (MICAD) [Internet]. Bethesda (MD): National Center for Biotechnology Information (US); 2004–2013. PMID: 20641467 Free Books & Documents. Review.
Cited by
-
Mass spectrometry imaging and profiling of single cells.J Proteomics. 2012 Aug 30;75(16):5036-5051. doi: 10.1016/j.jprot.2012.03.017. Epub 2012 Mar 29. J Proteomics. 2012. PMID: 22498881 Free PMC article. Review.
-
Multivariate analysis of ToF-SIMS data from multicomponent systems: the why, when, and how.Biointerphases. 2012 Dec;7(1-4):49. doi: 10.1007/s13758-012-0049-3. Epub 2012 Aug 15. Biointerphases. 2012. PMID: 22893234 Free PMC article. Review.
References
-
- Wei H, Ooi TH, Tan G, Lim SY, Qian L, Wong P, Shim W. Cell delivery and tracking in post-myocardial infarction cardiac stem cell therapy: an introduction for clinical researchers. Heart Fail Rev. 15(1):1–14. - PubMed
-
- Rittenberg D, Keston A, Rosebury F, Schoenheimer R. Studies in Protein Metabolism II. The Determination of Nitrogen Isotopes in Organic Compounds. Journal of Biologic Chemistry. 1939;127:291–299.
-
- Sprinson D, Rittenberg D. The Rate of Interaction of the Amino Acids of the Diet with the Tissue Proteins. Journal of Biologic Chemistry. 1949;180:715–726. - PubMed
-
- Young VR, Ajami A. The Rudolf Schoenheimer Centenary Lecture. Isotopes in nutrition research. Proc Nutr Soc. 1999;58(1):15–32. - PubMed
Grants and funding
LinkOut - more resources
Full Text Sources