Review
. 2014 Mar 26:8:611-21.
doi: 10.2147/OPTH.S44586. eCollection 2014.

Strategies for improving early detection of glaucoma: the combined structure-function index

Affiliations
Review

Strategies for improving early detection of glaucoma: the combined structure-function index

Andrew J Tatham et al. Clin Ophthalmol. .

Abstract

The early detection of glaucoma is important in order to enable appropriate monitoring and treatment, and to minimize the risk of irreversible visual field loss. Although advances in ocular imaging offer the potential for earlier diagnosis, the best method is likely to involve a combination of information from structural and functional tests. Recent studies have shown it is possible to estimate the number of retinal ganglion cells from optical coherence tomography and standard automated perimetry, and to then pool the results to produce a combined structure-function index (CSFI). The CSFI represents the estimated percentage of retinal ganglion cells lost compared to an age-matched healthy eye. Previous studies have suggested that the CSFI is better able to detect glaucoma than isolated measures of structure and function, and that it performs well even in preperimetric glaucoma. The purpose of this review is to describe new strategies, such as the CSFI, that have the potential to improve the early detection of glaucoma. We also describe how our ability to detect early glaucoma may be further enhanced by incorporating demographic risk factors, clinical examination findings, and imaging and functional test results into intuitive models that provide estimates of disease probability.

Keywords: OCT; glaucoma; optical coherence tomography; perimetry; retinal ganglion cells; spectral domain.


Figures

Figure 1
Figure 1
Scatter plot showing the relationship between standard automated perimetry (SAP) mean deviation and estimated number of retinal ganglion cells (RGCs).
Figure 2
Figure 2
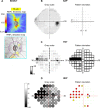
(AD) Perimetric test results using three devices for the right eye of a subject with glaucoma. Spectral domain optical coherence tomography (SDOCT) shows inferior retinal nerve fiber layer thinning (A). Standard automated perimetry (SAP) shows a possible early superonasal defect (B), which is confirmed on frequency-doubling technology (FDT) perimetry (C) and with the flicker-defined form Heidelberg edge perimeter (HEP) (D). Abbreviation: RNFL, retinal nerve-fiber layer.
Figure 3
Figure 3
Example of a patient with progressive glaucomatous changes on optic disc photographs. Throughout follow-up, standard automated perimetry indices, including the glaucoma hemifield test (GHT) and mean deviation, remained within normal limits. At the most recent visit, spectral domain optical coherence tomography showed evidence of inferior retinal nerve fiber-layer loss. The estimated retinal ganglion cell (RGC) count at the most recent follow-up was 705,082 cells, and the combined structure–function index (CSFI) was 29%, indicating the eye had lost 29% of RGCs compared to that expected in a healthy age-matched eye. Abbreviation: RNFL, retinal nerve-fiber layer.
Figure 4
Figure 4
Receiver operating-characteristic curve for discriminating preperimetric glaucomatous eyes from healthy eyes for standard automated perimetry visual field index (VFI) (area under the curve [AUC] =0.51), optical coherence tomography average retinal nerve-fiber layer (RNFL) thickness (AUC =0.88) and the combined structure–function index (CSFI; AUC =0.85). Note: Reprinted from Medeiros FA, Lisboa R, Weinreb RN, Girkin CA, Liebmann JM, Zangwill LM. A combined index of structure and function for staging glaucomatous damage. Arch Ophthalmol. 2012;130:1107–1116. Copyright © 2012 American Medical Association. All rights reserved.
Figure 5
Figure 5
Example of use of the longitudinal risk calculator in two eyes with suspected glaucoma, as described by Meira-Freitas et al. The dashed vertical line represents the time point of last examination, with points to the left of the dashed line indicating estimated retinal ganglion cell (RGC) counts at each visit. The predicted survival probabilities are shown to the right of the dashed vertical line. Patient one has relatively stable measurements over time and a high probability of survival, ie, not developing glaucoma, of 0.8 at 8 years. Patient two has a relatively fast rate of decline in estimated RGCs and a high probability of glaucoma. Note: Reprinted from Meira-Freitas D, Lisboa R, Tatham A, et al. Predicting progression in glaucoma suspects with longitudinal estimates of retinal ganglion cell counts. Invest Ophthalmol Vis Sci. 2013;54:4174–4183. Copyright © 2013 The Association for Research in Vision and Ophthalmology, Inc.

References

    1. Weinreb RN, Khaw PT. Primary open-angle glaucoma. Lancet. 2004;363:1711–1720. - PubMed
    1. Spaeth G, Walt J, Keener J. Evaluation of quality of life for patients with glaucoma. Am J Ophthalmol. 2006;141:3–14. - PubMed
    1. Resnikoff S, Pascolini D, Etya’ale D, et al. Global data on visual impairment in the year 2002. Bull World Health Organ. 2004;82:844–851. - PMC - PubMed
    1. Quigley HA, Broman AT. The number of people with glaucoma worldwide in 2010 and 2020. Br J Ophthalmol. 2006;90:262–267. - PMC - PubMed
    1. McKean-Cowdin R, Varma R, Wu J, Hays RD, Azen SP. Severity of visual field loss and health-related quality of life. Am J Ophthalmol. 2007;143:1013–1023. - PMC - PubMed