. 2014 Apr 7:12:25.
doi: 10.1186/1478-811X-12-25.

Slit2N and Robo4 regulate lymphangiogenesis through the VEGF-C/VEGFR-3 pathway

Affiliations

Slit2N and Robo4 regulate lymphangiogenesis through the VEGF-C/VEGFR-3 pathway

Jinlong Yu et al. Cell Commun Signal. .

Abstract

Background: Signaling through vascular endothelial growth factor C (VEGF–C) and VEGF receptor 3 (VEGFR-3) plays a central role in lymphangiogenesis and the metastasis of several cancers via the lymphatics. Recently, the Slit2/Robo4 pathway has been recognized as a modulator of vascular permeability and integrity. Signaling via the Robo receptor inhibits VEGF-mediated effects; however, its effects on lymphatic endothelial cell function have not been well characterized.

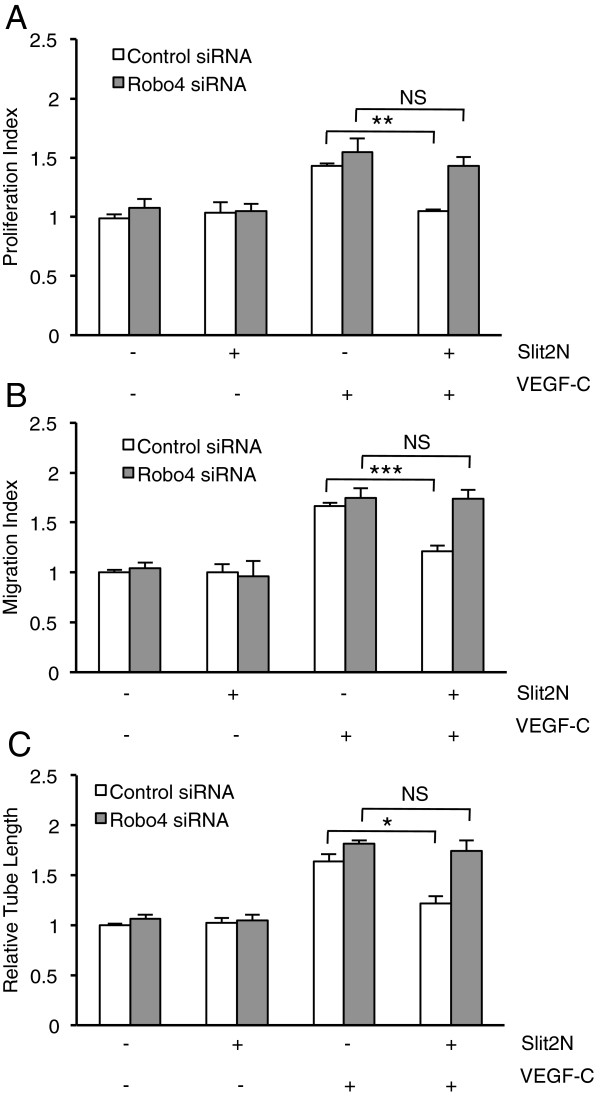
Results: We found that pretreatment with Slit2N, an active fragment of Slit2, inhibited VEGF-C-mediated lung-derived lymphatic endothelial cell (L-LEC) proliferation, migration, and in vitro tube formation. Slit2N induced the internalization of VEGFR-3, which blocked its activation, and inhibited the activation of the PI3K/Akt pathway by VEGF-C in L-LECs. Moreover, we found that inhibition of VEGF-C-induced effects by Slit2N was Robo4-dependent.

Conclusion: These results indicate that Slit2N/Robo4 modulates several key cellular functions, which contribute to lymphangiogenesis, and identify this ligand-receptor pair as a potential therapeutic target to inhibit lymphatic metastasis of VEGF-C-overexpressing cancers and manage lymphatic dysfunctions characterized by VEGF-C/VEGFR-3 activation.


Figures

Figure 1
Figure 1
Slit2N inhibits VEGF-C-enhanced growth, migration and tube formation of L-LECs. (A) Proliferation of L-LECs as assessed by MTS assay after incubation with control, 10 nM Slit2N, or VEGF-C [100 ng/ml]; or after preincubation with Slit2N, then VEGF-C. Data represent the mean ± SD of 3 independent experiments (*p < 0.05). (B) Transwell migration of L-LECs after treatment with control, 10 nM Slit2N, or VEGF-C [100 ng/ml]; or after preincubation with Slit2N, then VEGF-C. Data represent the mean ± SD of 3 independent experiments (***p < 0.001). (C) Representative tube formation assay on ECM of L-LECs after treatment with control, 10 nM Slit2N, or VEGF-C [100 ng/ml]; or after preincubation with Slit2N, then VEGF-C. (D) Average length of L-LEC tubes as assessed by in vitro tube formation assay on ECM after treatment with 10 nM Slit2N, VEGF-C [100 ng/ml]; or after preincubation with Slit2N, then VEGF-C, relative to average tube length of untreated cells (Slit2N “-”, VEGF-C “-”). Data represent the mean ± SD of 3 independent experiments (*p < 0.05). (E) Representative Western blot analysis of Slit2N expression in L-LECs transduced with a control adenovirus (Ctrl) or with an adenovirus expressing V5-tagged Slit2N. GAPDH used as loading control. (F) Average length of L-LEC tubes in L-LECs transduced with a control adenovirus (Slit2N-Adenovirus “-”) or in L-LECs transduced with a Slit2N-expressing adenovirus (Slit2N-Adenovirus “+”) as assessed by in vitro tube formation assay on ECM after incubation with control (VEGF-C “-”) or with VEGF-C [100 ng/ml] (VEGF-C “+”), relative to average tube length of untreated L-LECs transduced with control adenovirus (Slit2N-Adenovirus “-”, VEGF-C “-”). Data represent the mean ± SD of 3 independent experiments (***p < 0.001).
Figure 2
Figure 2
Slit2N attenuates VEGF-C-induced activation of VEGFR-3 in L-LECs. (A) Representative VEGFR-3 IP/Western blot analysis of phosphorylated VEGFR-3 in L-LECs after pretreatment with various concentrations of Slit2N, and incubation with VEGF-C [100 ng/ml]. Total VEGFR-3 used as loading control. (B) Quantitative analysis of VEGFR-3 IP/Western blot analysis of phosphorylated VEGFR-3 in L-LECs after pretreatment with various concentrations of Slit2N, and incubation with VEGF-C. Band intensities from Figure 2A were determined by densitometry. The ratio of p-VEGFR-3/total VEGFR-3 of L-LECs treated with VEGF-C alone (2nd lanes from the left) was set to “1” and the ratios of all other conditions were calculated vs. this experimental condition. Data represent the mean ± SD of 3 independent experiments (*p < 0.05; **p < 0.01). (C) Representative Western blot analysis of phosphorylated VEGFR-2 in L-LECs after pretreatment with various concentrations of Slit2N, and incubation with VEGF-C [100 ng/ml]. Total VEGFR-2 used as loading control. (D) Quantitative analysis of Western blot analysis of phosphorylated VEGFR-2 in L-LECs after pretreatment with various concentrations of Slit2N, and incubation with VEGF-C. Band intensities from Figure 2C were determined by densitometry. The ratio of p-VEGFR-2/total VEGFR-2 of L-LECs treated with VEGF-C alone (2nd lanes from the left) was set to “1” and the ratios of all other conditions were calculated vs. this experimental condition. Data represent the mean ± SD of 3 independent experiments.
Figure 3
Figure 3
Effects of Slit2N and VEGF-C on total VEGFR-3 levels and VEGFR-3 surface presentation/internalization in L-LECs. (A) Representative Western blot analysis of surface and total VEGFR-3 in L-LECs after incubation with 10 nM Slit2N for indicated times. GAPDH: loading control. (B) Quantitative analysis of surface VEGFR-3 in L-LECs after incubation with 10 nM Slit2N for indicated times. Band intensities from Figure 3A were determined by densitometry. Ratio of surface VEGFR-3/GAPDH in untreated L-LECs (“0” lanes) was set to “1” and values of other ratios were calculated vs. this control. (C) Quantitative analysis of total VEGFR-3 in L-LECs after incubation with 10 nM Slit2N for indicated times. Band intensities from Figure 3A were determined by densitometry. Ratio of total VEGFR-3/GAPDH in untreated L-LECs (“0” lanes) was set to “1” and values of other ratios were calculated vs. untreated control. (D) Representative Western blot analysis of membrane-bound VEGFR-3 (Surface VEGFR-3) and total VEGFR-3 in L-LECs after incubation with VEGF-C alone [100 ng/ml], and 10 nM Slit2N pretreatment + VEGF-C for indicated times. GAPDH: loading control. (E) Quantitative analysis of surface VEGFR-3 in L-LECs after incubation with VEGF-C alone [100 ng/ml] (Control), and 10 nM Slit2N pretreatment + VEGF-C for indicated times. Band intensities from Figure 3D were determined by densitometry. Ratio of surface VEGFR-3/GAPDH of untreated L-LECs was set to “1” and values of all other ratios were calculated vs. untreated control. (F) Quantitative analysis of total VEGFR-3 in L-LECs after incubation with VEGF-C alone [100 ng/ml] (Control), and 10 nM Slit2N pretreatment + VEGF-C for indicated times. Band intensities from Figure 3D were determined by densitometry. Ratio of total VEGFR-3/GAPDH of untreated L-LECs was set to “1” and values of other ratios were calculated vs. untreated control. Data for (B), (C), (E) and (F) represent the mean ± SD of 3 independent experiments (***p < 0.001).
Figure 4
Figure 4
Slit2N inhibits VEGF-C-enhanced PI3K activity and Akt phosphorylation in L-LECs. (A) Representative Western blot analysis of phosphorylated ERK1/2 in L-LECs, after treatment with control, VEGF-C alone [100 ng/ml]; or after preincubation with various concentrations of Slit2N, then VEGF-C. Total ERK1/2 used as loading control. (B) Quantitative analysis of phosphorylated ERK1/2 in L-LECs, after treatment with control, VEGF-C alone [100 ng/ml]; or after preincubation with various concentrations of Slit2N, then VEGF-C. Band intensity of each lane from Figure 4A was determined by densitometry. The ratio of p-ERK1/2 to total ERK1/2 of L-LECs incubated with VEGF-C alone was set to “1” and values of all other ratios were calculated vs. this control. Data represent the mean ± SD of 3 independent experiments. (C) PI3K activity by ELISA in L-LECs incubated with various concentrations of Slit2N and/or VEGF-C [100 ng/ml]. Data represent the mean ± SD of 3 independent experiments (**p < 0.01, ***p < 0.001). (D) Representative Western blot analysis of phosphorylated Akt in L-LECs incubated with a control, VEGF-C [100 ng/ml]; or preincubated with various concentrations of Slit2N, then VEGF-C. Total Akt used as loading control. (E) Quantitative analysis of phosphorylated Akt in L-LECs, after treatment with control, VEGF-C alone [100 ng/ml]; or after preincubation with various concentrations of Slit2N, then VEGF-C. Band intensity of each lane from Figure 4D was determined by densitometry. The ratio of p-Akt to total Akt of L-LECs incubated with VEGF-C alone was set to “1” and values of all other ratios were calculated vs. this control. Data represent the mean ± SD of 3 independent experiments (**p < 0.01).
Figure 5
Figure 5
Slit2N inhibits VEGF-C-induced activation of VEGFR-3 in 293/VEGFR-3 transfectants and L-LECs in a Robo4-dependent manner. (A) Representative Western blot analysis of Robo1 and Robo4 expression in L-LECs, HMVECs, and 293/VEGFR-3 cells. GAPDH used as loading control. (B) Representative Western blot analysis of Robo4 and Robo1 expression in 293/VEGFR-3 cells, 24 h after transfection with pCMV-RFP (vector) or pCMV-RFP-Robo4 (Robo4). GAPDH used as loading control. (C) Representative VEGFR-3 IP/Western blot analysis of phosphorylated VEGFR-3. 293/VEGFR-3 cells were transfected with pCMV-RFP (vector) or pCMV-RFP-Robo4 (Robo4). After 48 h, cells were incubated with a control (“- -”), 10 nM Slit2N, or VEGF-C [100 ng/ml]; or pretreated with Slit2N, then VEGF-C. Total VEGFR-3 used as loading control. (D) Quantitative analysis by densitometry of Figure 5C. The ratio of p-VEGFR-3/VEGFR-3 in vector-transfected L-LECs incubated with VEGF-C alone was set to “1” and all other ratios were determined vs. this control. Data represent the mean ± SD of 3 independent experiments (***p < 0.001). (E) Representative Western blot analysis of Robo4 and Robo1 expression in L-LECs, 24 h after transfection with control siRNAs or Robo4-specific siRNAs. GAPDH used as loading control. (F) Representative VEGFR-3 IP/Western blot analysis of phosphorylated VEGFR-3 in L-LECs transfected with control siRNAs or Robo4-specific siRNAs, after incubation with control, VEGF-C [100 ng/ml]; or pretreatment with 10 nM Slit2N, then VEGF-C. Total VEGFR-3 used as loading control. (G) Quantitative analysis by densitometry of Figure 5F. The ratio of p-VEGFR-3/VEGFR-3 in control siRNA-transfected L-LECs incubated with VEGF-C alone was set to “1” and all other ratios were determined vs. this control. Data represent the mean ± SD of 3 independent experiments (*p < 0.05).
Figure 6
Figure 6
Slit2N inhibition of VEGF-C-enhanced PI3K activity and Akt phosphorylation in L-LECs is Robo4-dependent. (A) PI3K activity by ELISA in L-LECs transfected with control siRNAs or Robo4-specific siRNAs, incubated with control or VEGF-C [100 ng/ml]; or after pretreatment with 10 nM Slit2N, then VEGF-C. Data represent the mean ± SD of 3 independent experiments (*p < 0.05; NS: not statistically significant). (B) Representative Western blot analysis of Akt phosphorylation in L-LECs transiently transfected with control siRNAs or Robo4-specific siRNAs, and subsequently incubated with 10 nM Slit2N, VEGF-C [100 ng/ml]; or after pretreatment with Slit2N, then VEGF-C. Total Akt used as loading control. (C) Quantitative analysis of Akt phosphorylation in L-LECs transiently transfected with control siRNAs or Robo4-specific siRNAs, and subsequently incubated with 10 nM Slit2N, VEGF-C [100 ng/ml]; or after pretreatment with Slit2N, then VEGF-C. Band intensity of each lane from Figure 6B was determined by densitometry. The ratio of p-Akt/total Akt in control siRNA-transfected L-LECs incubated with VEGF-C alone was set to “1” and all other ratios were determined vs. this control. Data represent the mean ± SD of 3 independent experiments (***p < 0.001).
Figure 7
Figure 7
Slit2N inhibits VEGF-C-enhanced growth, migration, and tube formation of L-LECs in a Robo4-dependent manner. (A) Proliferation of L-LECs transiently transfected with control siRNAs or Robo4-specific siRNAs as assessed by MTS assay after treatment with control, 10 nM Slit2N, VEGF-C [100 ng/ml]; or after preincubation with Slit2N, then VEGF-C. Data represent the mean ± SD of 3 independent experiments (**p < 0.01; NS: not statistically significant). (B) Transwell migration of L-LECs transiently transfected with control siRNAs or Robo4-specific siRNAs after treatment with control, 10 nM Slit2N, VEGF-C [100 ng/ml]; or after preincubation with Slit2N, then VEGF-C. Data represent the mean ± SD of 3 independent experiments (***p < 0.001; NS: not statistically significant). (C) Relative length of tubes formed by L-LECs transiently transfected with control siRNAs or Robo4-specific siRNAs as assessed by in vitro tube formation assay on ECM after treatment with control, 10 nM Slit2N, VEGF-C [100 ng/ml]; or after preincubation with Slit2N, then VEGF-C. Data represent the mean ± SD of 3 independent experiments (*p < 0.05; NS: not statistically significant). For panels A, B, and C, proliferative index, migration index, and relative tube length, respectively, were set to “1” for control-siRNA-transfected, untreated cells. Data for all other conditions were calculated relative to these controls.

Similar articles

Cited by

References

    1. Wang Y, Oliver G. Current views on the function of the lymphatic vasculature in health and disease. Genes Dev. 2010;24:2115–2126. doi: 10.1101/gad.1955910. - DOI - PMC - PubMed
    1. Bahram F, Claesson-Welsh L. VEGF-mediated signal transduction in lymphatic endothelial cells. Pathophysiology: the official journal of the International Society for Pathophysiology/ISP. 2010;17:253–261. - PubMed
    1. Salameh A, Galvagni F, Bardelli M, Bussolino F, Oliviero S. Direct recruitment of CRK and GRB2 to VEGFR-3 induces proliferation, migration, and survival of endothelial cells through the activation of ERK, AKT, and JNK pathways. Blood. 2005;106:3423–3431. doi: 10.1182/blood-2005-04-1388. - DOI - PubMed
    1. Joukov V, Pajusola K, Kaipainen A, Chilov D, Lahtinen I, Kukk E, Saksela O, Kalkkinen N, Alitalo K. A novel vascular endothelial growth factor, VEGF-C, is a ligand for the Flt4 (VEGFR-3) and KDR (VEGFR-2) receptor tyrosine kinases. EMBO J. 1996;15:290–298. - PMC - PubMed
    1. Kurebayashi J, Otsuki T, Kunisue H, Mikami Y, Tanaka K, Yamamoto S, Sonoo H. Expression of vascular endothelial growth factor (VEGF) family members in breast cancer. Jpn J Canc Res. 1999;90:977–981. doi: 10.1111/j.1349-7006.1999.tb00844.x. - DOI - PMC - PubMed

Publication types

MeSH terms

Substances