. 2014 Apr 7:13:39.
doi: 10.1186/1475-925X-13-39.

Video image-based analysis of single human induced pluripotent stem cell derived cardiomyocyte beating dynamics using digital image correlation

Affiliations

Video image-based analysis of single human induced pluripotent stem cell derived cardiomyocyte beating dynamics using digital image correlation

Antti Ahola et al. Biomed Eng Online. .

Abstract

Background: The functionality of a cardiomyocyte is primarily measured by analyzing the electrophysiological properties of the cell. The analysis of the beating behavior of single cardiomyocytes, especially ones derived from stem cells, is challenging but well warranted. In this study, a video-based method that is non-invasive and label-free is introduced and applied for the study of single human cardiomyocytes derived from induced pluripotent stem cells.

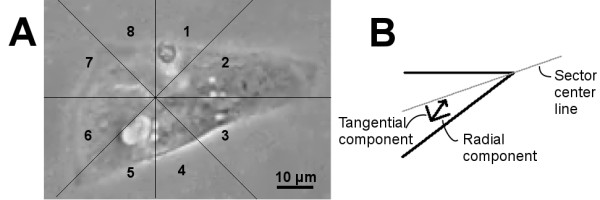
Methods: The beating of dissociated stem cell-derived cardiomyocytes was visualized with a microscope and the motion was video-recorded. Minimum quadratic difference, a digital image correlation method, was used for beating analysis with geometrical sectorial cell division and radial/tangential directions. The time series of the temporal displacement vector fields of a single cardiomyocyte was computed from video data. The vector field data was processed to obtain cell-specific, contraction-relaxation dynamics signals. Simulated cardiomyocyte beating was used as a reference and the current clamp of real cardiomyocytes was used to analyze the electrical functionality of the beating cardiomyocytes.

Results: Our results demonstrate that our sectorized image correlation method is capable of extracting single cell beating characteristics from the video data of induced pluripotent stem cell-derived cardiomyocytes that have no clear movement axis, and that the method can accurately identify beating phases and time parameters.

Conclusion: Our video analysis of the beating motion of single human cardiomyocytes provides a robust, non-invasive and label-free method to analyze the mechanobiological functionality of cardiomyocytes derived from induced pluripotent stem cells. Thus, our method has potential for the high-throughput analysis of cardiomyocyte functions.


Figures

Figure 1
Figure 1
Beating analysis framework. A: The cell is divided into 8 sectors, each being of 45°, with the center point being at the observed beating focus point of the cell. The sectors are numbered in a clockwise manner. B: The radial and tangential components of the velocity vectors in each sector are calculated with regard to the sector centerline going through the beating focus point.
Figure 2
Figure 2
Artificial data set created from a cardiomyocyte image. An even grid and a cardiomyocyte image are shown to illustrate the effect of the artificial deformation that was used to create the data set. A: An even grid and a cardiomyocyte image without the artificial deformation. B: An even grid and a cardiomyocyte image with the described deformation applied, γ = 10.
Figure 3
Figure 3
Characterization of iPS cells for their pluripotency. Number 1 represents the cell line UTA.04602.WT and 2 the line UTA.04607.WT. A: iPS cells formed typical colonies for pluripotent stem cells that are rather compact and round in shape. B: The iPS cell colonies typically had well defined edges and distinct cell borders, and the iPS cells had a high nucleus to cytoplasm -ratio and a large nucleoli characteristic for stem cells. C: Endogenous pluripotency gene expression was studied using RT-PCR. Nanog, Oct4, Sox2 and Rex1 were all expressed at mRNA level in the iPS cells. β-actin and GAPDH were used as housekeeping control genes for both endogenous and exogenous markers. D: The expression of pluripotency genes was also studied at the protein level by immunocytochemical staining. The iPS cell expressed several markers for the pluripotent state: Nanog, Oct4, Sox2, SSEA4, TRA-1-60, and TRA-1-81 (all in red). Pictures in the left panel are from the line UTA.04602.WT and the ones on the right side are from UTA.04607.WT. Blue in all pictures indicates the DAPI staining of nuclei. E: Using RT-PCR, it was shown that all the transgenes were silenced in the iPS cells. Negative control is marked with “-” and positive control with “+”. F: Embryoid body (EB) -assay was used to define the pluripotency of the iPS cells in vitro. Markers for all three germ layers were detected from the EBs formed from both cell lines. Alpha-fetoprotein (AFP) was used as a marker for endoderm, kinase insert domain receptor (KDR, also known as vascular endothelial growth factor receptor 2 (VEGFR-2) was used as a marker for mesoderm and nestin was used as an ectoderm marker. GAPDH was used as an endogenous control gene.
Figure 4
Figure 4
Karyotype analysis from iPS cells. A &B: The lines were verified for normal karyotypes (G: UTA.04602.WT and H: UTA.04607.WT).
Figure 5
Figure 5
Cardiomyocytes differentiated from the iPS cells. A: Several cardiac markers were discovered using RT-PCR indicating their expression at mRNA level. Data from UTA.04602.WT is shown here. B: By immunocytochemical staining it was shown that the iPS cell-derived cardiac cells express proteins specific for cardiomyocytes. Cardiac troponin T, α-actinin, myosin heavy chain (MHC) and atrial myosin light chain 2 (MLC2a) were detected from the cells. The pictures on the left side are from the line UTA.04602.WT and the pictures on the right side are from UTA.04607.WT. In the pictures showing MHC and MLC2a with green fluorescent, red indicates troponin T and in all pictures DAPI staining of nuclei is seen in blue. C &D: A micro electrode array (MEA) was used to define the electrical properties of the iPS cell-derived cardiomyocytes. The beating rates (BR) and field potential durations (FPD) of cell aggregates were evaluated (B: UTA.04602.WT, BR = 58, FPD = 283 ms and C: UTA.04607.WT, BR = 66, FPD = 391 ms).
Figure 6
Figure 6
The beating signals obtained from an iPS cell-derived CM. A: The classification of beating phases. The time between each individual beat is marked with I. Contraction movement is defined as negative movement (marked with II) and relaxation movement as positive (marked with III). B: An enlarged image of the sector 8 radial component. C: The beating signals of each sector obtained from one of the measured CMs. For various sectors, the contraction seems to push certain areas away from the perceived beating focus point. This results in an upward peak in lieu of a downward peak due to the fusiform nature of the beating. While most sectors produce a signal of high quality, sectors such as radial 5 have too little movement to generate a well-formed displacement signal.
Figure 7
Figure 7
Comparison of measured and known motion signals in different sectors. A CM image was modified using image-processing methods with varying parameters to create a video resembling the contraction and relaxation of the cell. In the upper row are illustrated A: the sector division, B: the velocity vector field during the contraction, and C: the known displacement velocity. Since the artificial displacement has circular symmetry, a horizontal cross-sectional displacement is shown. D: The proposed method was applied to the video data and the signal marked with red was obtained. A blue signal illustrates the known displacement field.
Figure 8
Figure 8
Assessment of the effect of noise on video beating analysis. Varying degrees of speckle noise variance were added to a video for testing noise resistance. A-D: Example images for four noise variance levels are shown: 0, 0.003, 0.005, and 0.015.
Figure 9
Figure 9
Combined current clamp and displacement data for a cell. A: Concurrent action potential and displacement signal, integrated with respect to time from the movement data obtained from the video data, are plotted in the same figure. The action potential data is shown in red and the movement data in black. For current clamp data, the potential in mV is shown, whereas for movement data, the y-axis is arbitrary. B: Image from the video data used for the analysis of a CM being recorded with current clamp. C: An enlarged part of the signal showing the time difference between the action potential and the displacement signal.

References

    1. Pollard C, Valentin JP, Hammond T. Strategies to reduce the risk of drug-induced QT interval prolongation: a pharmaceutical company perspective. Br J Pharmacol. 2008;154:1538–1543. - PMC - PubMed
    1. Takahashi K, Tanabe K, Ohnuki M, Narita M, Ichisaka T, Tomoda K, Yamanaka S. Induction of pluripotent stem cells from adult human fibroblasts by defined factors. Cell. 2007;131:861–872. - PubMed
    1. Zhang J, Wilson GF, Soerens AG, Koonce CH, Yu J, Palacek SP, Thomson JA, Kamp TJ. Functional cardiomyocytes derived from human induced pluripotent stem cells. Circ Res. 2009;104:e30–e41. - PMC - PubMed
    1. Harris K, Aylott M, Cui Y, Louttit JB, McMahon NC, Sridhar A. Comparison of electrophysiological data from human-induced pluripotent stem cell-derived cardiomyocytes to functional preclinical safety assays. Toxicol Sci. 2013;134:412–426. - PubMed
    1. Brüggemann A, Stoelzle S, George M, Behrends JC, Fertig N. Microchip technology for automated and parallel patch-clamp recording. Small. 2006;2:840–846. - PubMed

Publication types

MeSH terms