

Ownership and technical efficiency of hospitals: evidence from Ghana using data envelopment analysis
- PMID: 24708886
- PMCID: PMC4108084
- DOI: 10.1186/1478-7547-12-9
Ownership and technical efficiency of hospitals: evidence from Ghana using data envelopment analysis
Abstract
Background: In order to measure and analyse the technical efficiency of district hospitals in Ghana, the specific objectives of this study were to (a) estimate the relative technical and scale efficiency of government, mission, private and quasi-government district hospitals in Ghana in 2005; (b) estimate the magnitudes of output increases and/or input reductions that would have been required to make relatively inefficient hospitals more efficient; and (c) use Tobit regression analysis to estimate the impact of ownership on hospital efficiency.
Methods: In the first stage, we used data envelopment analysis (DEA) to estimate the efficiency of 128 hospitals comprising of 73 government hospitals, 42 mission hospitals, 7 quasi-government hospitals and 6 private hospitals. In the second stage, the estimated DEA efficiency scores are regressed against hospital ownership variable using a Tobit model. This was a retrospective study.
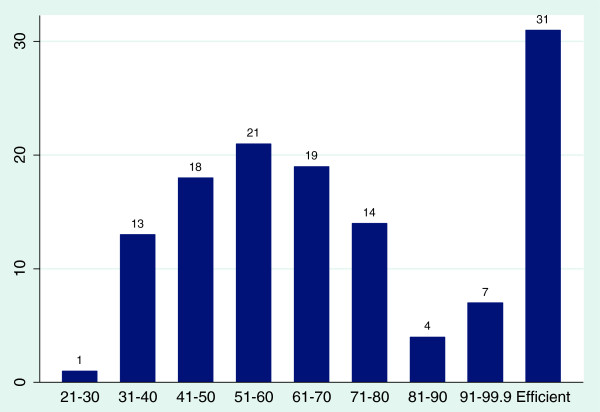
Results: In our DEA analysis, using the variable returns to scale model, out of 128 district hospitals, 31 (24.0%) were 100% efficient, 25 (19.5%) were very close to being efficient with efficiency scores ranging from 70% to 99.9% and 71 (56.2%) had efficiency scores below 50%. The lowest-performing hospitals had efficiency scores ranging from 21% to 30%.Quasi-government hospitals had the highest mean efficiency score (83.9%) followed by public hospitals (70.4%), mission hospitals (68.6%) and private hospitals (55.8%). However, public hospitals also got the lowest mean technical efficiency scores (27.4%), implying they have some of the most inefficient hospitals.Regarding regional performance, Northern region hospitals had the highest mean efficiency score (83.0%) and Volta Region hospitals had the lowest mean score (43.0%).From our Tobit regression, we found out that while quasi-government ownership is positively associated with hospital technical efficiency, private ownership negatively affects hospital efficiency.
Conclusions: It would be prudent for policy-makers to examine the least efficient hospitals to correct widespread inefficiency. This would include reconsidering the number of hospitals and their distribution, improving efficiency and reducing duplication by closing or scaling down hospitals with efficiency scores below a certain threshold. For private hospitals with inefficiency related to large size, there is a need to break down such hospitals into manageable sizes.
Figures
References
-
- WHO AFRO. Health financing: A strategy for the African Region. Brazzaville; 2006.
Grants and funding
LinkOut - more resources
Full Text Sources
Other Literature Sources
