

Time trends of polycyclic aromatic hydrocarbon exposure in New York City from 2001 to 2012: assessed by repeat air and urine samples
- PMID: 24709094
- PMCID: PMC4031101
- DOI: 10.1016/j.envres.2014.02.017
Time trends of polycyclic aromatic hydrocarbon exposure in New York City from 2001 to 2012: assessed by repeat air and urine samples
Abstract
Background: Exposure to air pollutants including polycyclic aromatic hydrocarbons (PAH), and specifically pyrene from combustion of fuel oil, coal, traffic and indoor sources, has been associated with adverse respiratory health outcomes. However, time trends of airborne PAH and metabolite levels detected via repeat measures over time have not yet been characterized. We hypothesized that PAH levels, measured repeatedly from residential indoor and outdoor monitors, and children׳s urinary concentrations of PAH metabolites, would decrease following policy interventions to reduce traffic-related air pollution.
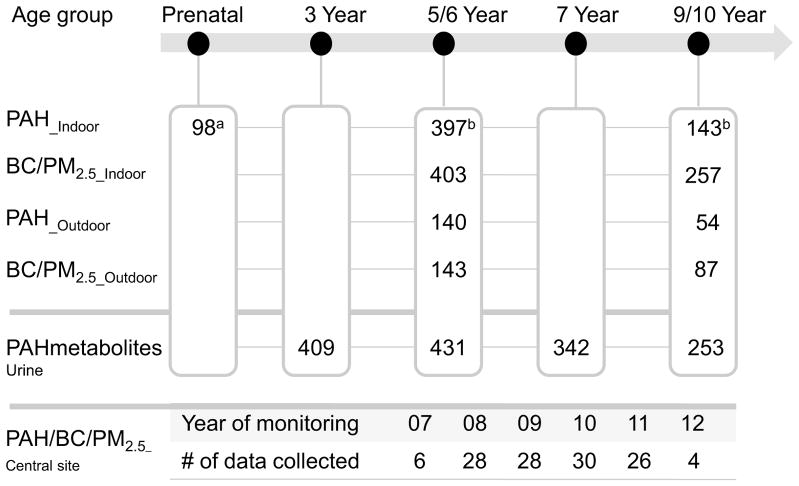
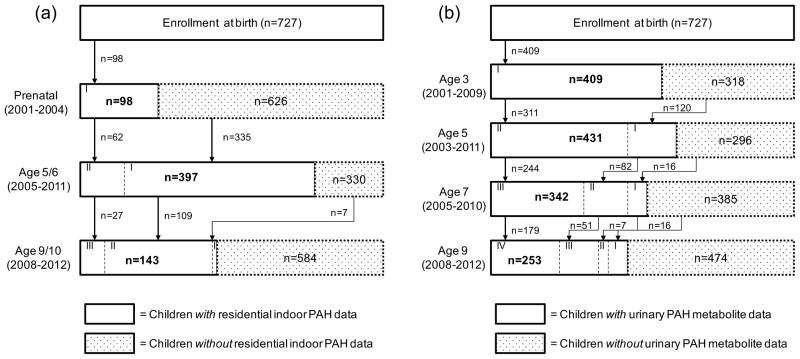
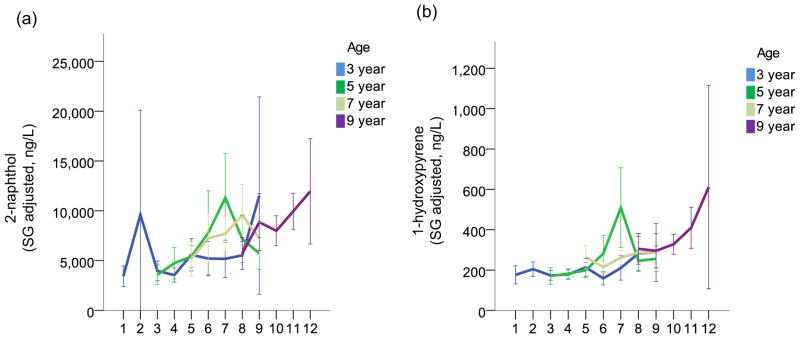
Methods: Indoor PAH (particle- and gas-phase) were collected for two weeks prenatally (n=98), at age 5/6 years (n=397) and age 9/10 years (n=198) since 2001 and at all three age-points (n=27). Other traffic-related air pollutants (black carbon and PM2.5) were monitored indoors simultaneous with PAH monitoring at ages 5/6 (n=403) and 9/10 (n=257) between 2005 and 2012. One third of the homes were selected across seasons for outdoor PAH, BC and PM2.5 sampling. Using the same sampling method, ambient PAH, BC and PM2.5 also were monitored every two weeks at a central site between 2007 and 2012. PAH were analyzed as semivolatile PAH (e.g., pyrene; MW 178-206) (∑8PAH(semivolatile): Including pyrene (PYR), phenanthrene (PHEN), 1-methylphenanthrene (1-MEPH), 2-methylphenanthrene (2-MEPH), 3-methylphenanthrene (3-MEPH), 9-methylphenanthrene (9-MEPH), 1,7-dimethylphenanthrene (1,7-DMEPH), and 3,6-dimethylphenanthrene (3,6-DMEPH)) and the sum of eight nonvolatile PAH (∑8PAH(nonvolatile): Including benzo[a]anthracene (BaA), chrysene/iso-chrysene (Chry), benzo[b]fluoranthene (BbFA), benzo[k]fluoranthene (BkFA), benzo[a]pyrene (BaP), indeno[1,2,3-c,d]pyrene (IP), dibenzo[a,h]anthracene (DahA), and benzo[g,h,i]perylene (BghiP); MW 228-278). A spot urine sample was collected from children at child ages 3, 5, 7 and 9 between 2001 and 2012 and analyzed for 10 PAH metabolites.
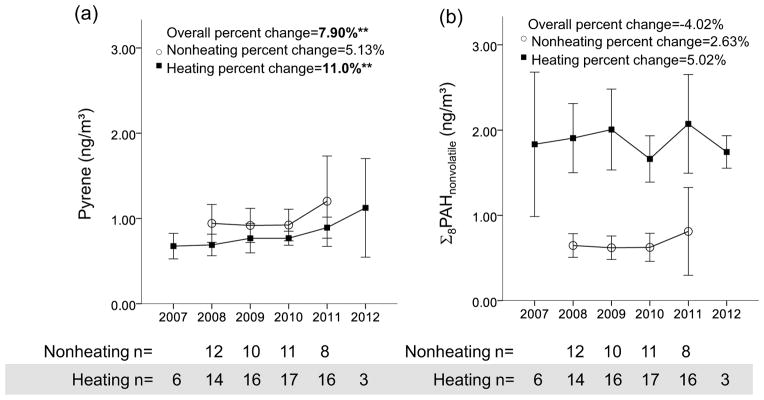
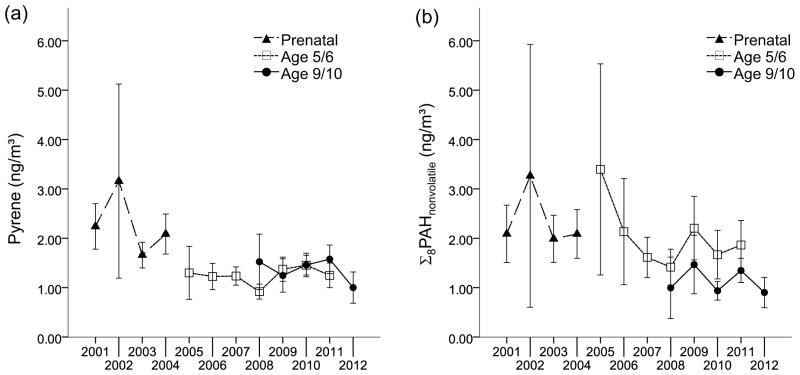
Results: Modest declines were detected in indoor BC and PM2.5 levels between 2005 and 2012 (Annual percent change [APC]=-2.08% [p=0.010] and -2.18% [p=0.059] for BC and PM2.5, respectively), while a trend of increasing pyrene levels was observed in indoor and outdoor samples, and at the central site during the comparable time periods (APC=4.81%, 3.77% and 7.90%, respectively; p<0.05 for all). No significant time trend was observed in indoor ∑8PAH(nonvolatile) levels between 2005 and 2012; however, significant opposite trends were detected when analyzed seasonally (APC=-8.06% [p<0.01], 3.87% [p<0.05] for nonheating and heating season, respectively). Similarly, heating season also affected the annual trends (2005-2012) of other air pollutants: the decreasing BC trend (in indoor/outdoor air) was observed only in the nonheating season, consistent with dominating traffic sources that decreased with time; the increasing pyrene trend was more apparent in the heating season. Outdoor PM2.5 levels persistently decreased over time across the seasons. With the analyses of data collected over a longer period of time (2001-2012), a decreasing trend was observed in pyrene (APC=-2.76%; p<0.01), mostly driven by measures from the nonheating season (APC=-3.54%; p<0.01). In contrast, levels of pyrene and naphthalene metabolites, 1-hydroxypyrene and 2-naphthol, increased from 2001 to 2012 (APC=6.29% and 7.90% for 1-hydroxypyrene and 2-naphthol, respectively; p<0.01 for both).
Conclusions: Multiple NYC legislative regulations targeting traffic-related air pollution may have led to decreases in ∑8PAH(nonvolatile) and BC, especially in the nonheating season. Despite the overall decrease in pyrene over the 2001-2012 periods, a rise in pyrene levels in recent years (2005-2012), that was particularly evident for measures collected during the heating season, and 2-naphthol, indicates the contribution of heating oil combustion and other indoor sources to airborne pyrene and urinary 2-naphthol.
Keywords: Heating oil combustion; Polycyclic aromatic hydrocarbons; Repeat exposure; Temporal variations; Trafficemission; Urinary metabolites.
Copyright © 2014 Elsevier Inc. All rights reserved.
Conflict of interest statement
Figures
References
-
- MTA. [Accessed on July 22, 2013];New York City transit and the environment. The clean fuel bus program. Available from http://web.mta.info/nyct/facts/ffenvironment.htm#clean_bus.
-
- The New York Times. [Accessed on March 25, 2013];Heating oil compnaies face inquiry on purity of fuel. Available from http://www.nytimes.com/
-
- ATSDR. Toxicological Profile for Naphthalene, 1-Methylnaphthalene, and 2-Methylnaphthalene. Agency for Toxic Substances and Disease Registry; Atlanta: 2005. [Accessed on June 4, 2013]. http://www.atsdr.cdc.gov/toxprofiles/tp.asp?id=240&tid=43.
-
- Cyrys J, et al. Comparison between different traffic-related particle indicators: elemental carbon (EC), PM2.5 mass, and absorbance. J Expo Anal Environ Epidemiol. 2003;13:134–43. - PubMed
Publication types
MeSH terms
Substances
Grants and funding
LinkOut - more resources
Full Text Sources
Other Literature Sources
Medical
