. 2013 Mar 6;2(1):136-62.
doi: 10.3390/cells2010136.

Induction of Cell Death Mechanisms and Apoptosis by Nanosecond Pulsed Electric Fields (nsPEFs)

Affiliations

Induction of Cell Death Mechanisms and Apoptosis by Nanosecond Pulsed Electric Fields (nsPEFs)

Stephen J Beebe et al. Cells. .

Abstract

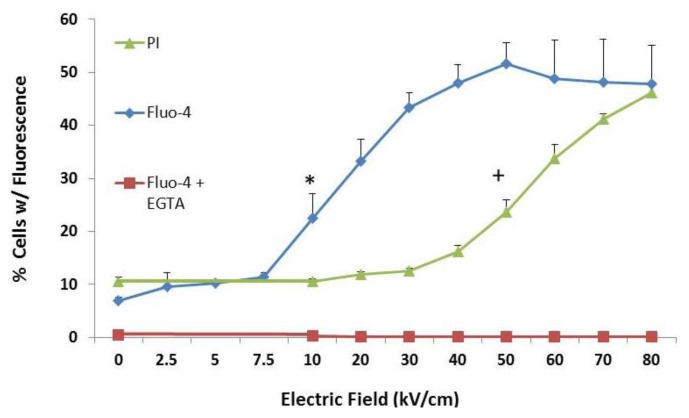
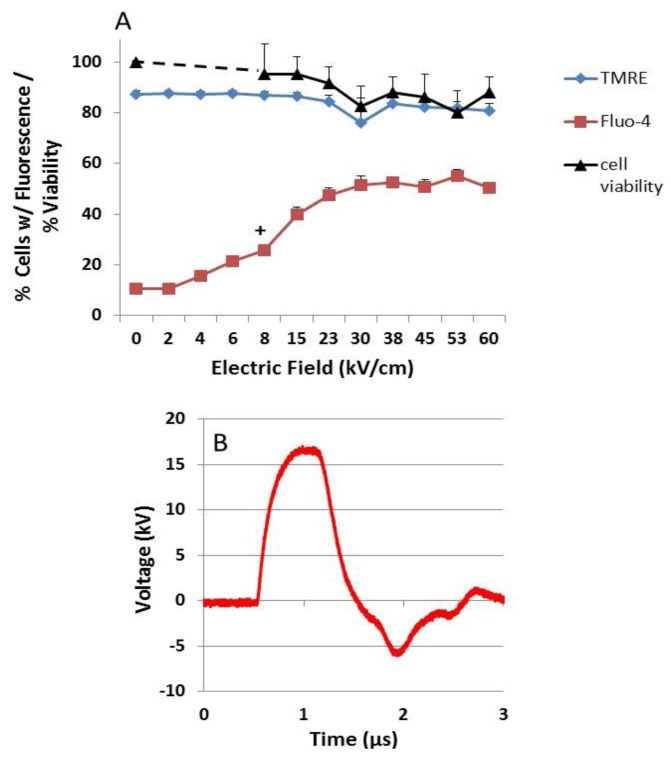
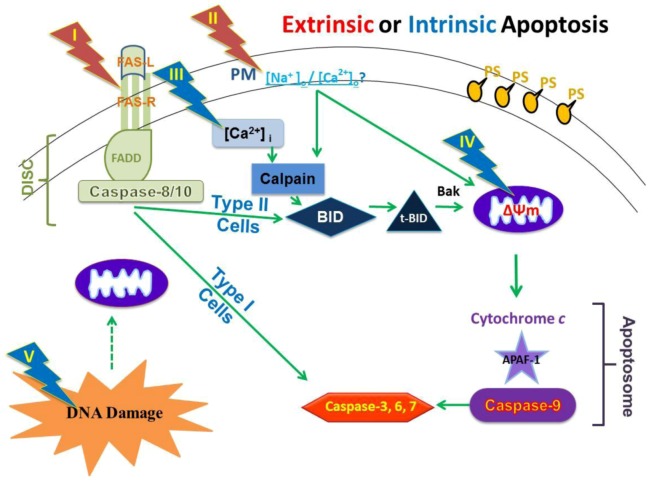
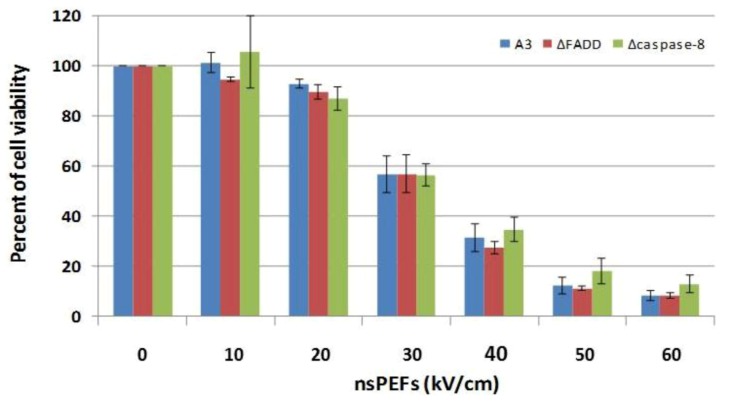
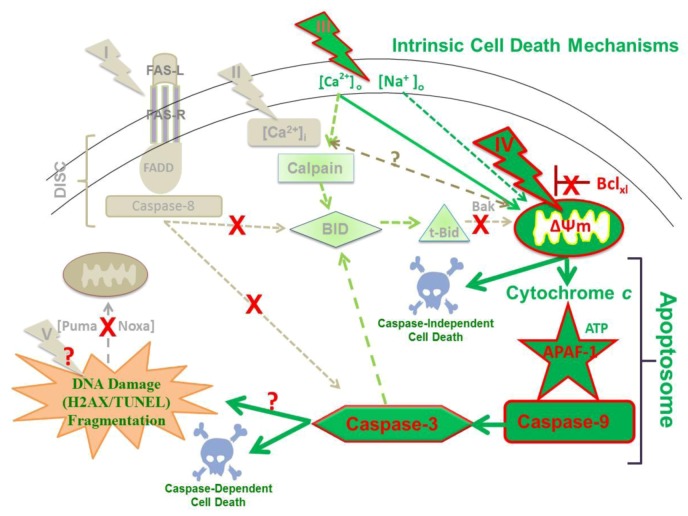
Pulse power technology using nanosecond pulsed electric fields (nsPEFs) offers a new stimulus to modulate cell functions or induce cell death for cancer cell ablation. New data and a literature review demonstrate fundamental and basic cellular mechanisms when nsPEFs interact with cellular targets. NsPEFs supra-electroporate cells creating large numbers of nanopores in all cell membranes. While nsPEFs have multiple cellular targets, these studies show that nsPEF-induced dissipation of ΔΨm closely parallels deterioration in cell viability. Increases in intracellular Ca2+ alone were not sufficient for cell death; however, cell death depended of the presence of Ca2+. When both events occur, cell death ensues. Further, direct evidence supports the hypothesis that pulse rise-fall times or high frequency components of nsPEFs are important for decreasing ΔΨm and cell viability. Evidence indicates in Jurkat cells that cytochrome c release from mitochondria is caspase-independent indicating an absence of extrinsic apoptosis and that cell death can be caspase-dependent and -independent. The Ca2+ dependence of nsPEF-induced dissipation of ΔΨm suggests that nanoporation of inner mitochondria membranes is less likely and effects on a Ca2+-dependent protein(s) or the membrane in which it is embedded are more likely a target for nsPEF-induced cell death. The mitochondria permeability transition pore (mPTP) complex is a likely candidate. Data demonstrate that nsPEFs can bypass cancer mutations that evade apoptosis through mechanisms at either the DISC or the apoptosome.


Figures

Figure 1
Figure 1
Nanosecond pulsed electric fields (NsPEFs) can induce nanopores larger than Ca2+ ions and smaller than PI molecules. N1-S1 HCC cells were treated with one 600 ns pulse with a rise-fall time of 15 ns at the electric fields indicated on the X-axis. Cells were loaded with Fluo-4 Direct as described in the Experimental Section. PI was added immediately after pulse treatments and cells were analyzed by flow cytometry 10 minutes after treatment. The Y-axis indicates the percentage of cells that exhibit fluorescence for either Fluo-4 or PI. When present, EGTA was 5 mM. Statistical significance is indicated at electric fields ≥ those electric fields with symbols; (;* p < 0.001 vs. PI control + p < 0.001 vs. Fluo-4 control (ANOVA with Tukey correction; n = 3). These data have been previously published in a different format [54].
Figure 2
Figure 2
NsPEF fast rise-fall times target ΔΨm and cell viability—(A and B) N1-S1 HCC cells were loaded with Fluo-4 Direct to determine Ca2+ influx (red squares) and with TMRE to determine ΔΨm (blue diamonds) by flow cytometry as described in the Experimental Section. The Y-axis indicates the percentage of cells with fluorescence for either Fluo-4 or TMRE, which were determined 10 minutes after nsPEF treatment. In parallel experiments, the percentage of viable cells (black triangles) was determined 24 hours after treatment as described in the Experimental Section. (C) Cells were treated with one 600 ns pulse with a 15 ns fast rise-fall time waveform (blue line, panel A) or a 150 ns slow rise-fall time waveform (red line, panel B) at the indicated electric fields. For Panels A and B significant differences from control sham treatment are indicated for all electric fields ≥ the symbol for Fluo-4 (+p < 0.001, n = 3,); for TMRE (# p < 0.03, n = 3) and cell viability (* p < 0.001, n =3 ). (Correction: ANOVA with Tukey’s correction). These data have been previously published in a different format [54].
Figure 3
Figure 3
NsPEF effects on ΔΨm determine viability – (A) N1-S1 HCC cells were loaded with Fluo-4 Direct to determine Ca2+ influx (red squares) and with TMRE to determine ΔΨm (blue diamonds) as described in the Experimental Section. The Y-axis indicates the percentage of cells with fluorescence for either Fluo-4 or TMRE, which were determined by flow cytometry 10 minutes after nsPEF treatment. In parallel experiments, the percentage of viable cells (black triangles) was determined 24 hours after treatment as described in the Experimental Section. (B) Cells were treated with one 600 ns pulse with a 150 ns slow rise-fall time waveform (red line, panel B) with a mismatched load. Statistical differences vs. sham control (0 kV/cm): All n = 3; No significance with cell viability or with TMRE; for Fluo-4, all electric fields ≥ 8 kV/cm, *p < 0.03. ANOVA Tukey’s correction.
Figure 4
Figure 4
NsPEF-induced dissipation of ΔΨm is Ca2+-dependent. N1-S1 cells were loaded with TMRE as indicated in the Experimental Section. Cells were then treated with one 600 ns pulse with a rise-fall time of 15 ns at either 40 or 60 kV/cm or sham treated (0 kV/cm). The Y-axis indicates the percentage of cells that exhibited fluorescence for TMRE as a measure of ΔΨm, which was determined by flow cytometry 10 minutes after treatment in the presence or absence of BAPTA-AM (20 μM) and/or EGTA (5 mM). The symbols indicate treatments that were significantly different (p < 0.05, n = 3) from sham treatment (0 kV/cm). There were no significant difference between treatments with EGTA and EGTA/BAPTA-AM compared to sham treated controls (0 kV/cm).
Figure 5
Figure 5
A model for determining nsPEF effects on cellular targets and apoptosis pathways. See text for details.
Figure 6
Figure 6
NsPEF-induced cell death in Jurkat clones does not require the DISC. Jurkat clones that are deficient in FADD (ΔFADD) or deficient in caspase-8 (Δcaspase-8) as well as the wildtype clone (A3) were treated with ten 60 ns pulses at 60 kV/cm and assayed for cell viability 24 hours after treatment as described in the Experimental Section. There were no significant differences among clones at any electric field. These data have been previously published in a different format [28].
Figure 7
Figure 7
NsPEF-induced cell death is caspase-dependent at lower electric fields (20–40 kV/cm) and caspase-independent at higher electric fields (≥ 50 kV/cm) at in Jurkat cells: A Jurkat clone deficient in APAF-1 and its vector control were tested with ten 60 ns pulses with increasing electric fields. Cell viability was determined 24 hours later - as described in the Experimental Section. The same results were obtained with the MTS assay. For statistical significance: + p < 0.05 vs. sham control (0 kV/cm); # p< 0.05 vector control clone vs. sh-APAF-1 clone; (n = 3). These data have been previously published in a different format [28].
Figure 8
Figure 8
NsPEFs induce Bid cleavage in a time-dependent manner in Jurkat cells. Cells were sham treated or exposed to ten 60 ns pulse at 60 kV/cm. Samples were prepared for immunoblot analysis at indicated times after pulsing. Extracts (50 μg protein) were separated by SDS-PAGE, transferred to PVDF membranes and probed with antibodies against various antigens (in kDa) A). Bak (25), Bcl-2 (28), Bcl-xl (30) and Actin (45) in the Wt clone; B). Puma (23), Noxa (15) and Actin (45) in the Wt clone; C). Bid (22), which also recognized t-Bid (15), and Actin (35) in three indicated clones. D). Bid and t-Bid from Jurkats A3 wildtype, FADD deficient (ΔFADD) and caspase-8 deficient (ΔC-8) were quantified using Odyssey infrared imager, normalized to total Bid levels in control and expressed as the ratio of fluorescence of t-Bid to fluorescence of Actin, a loading control. Values, mean ± SE (n=3) from experiments like that shown in C.
Figure 9
Figure 9
NsPEFs induce caspase- and calpain-dependent Bid cleavage in Jurkat cells. Jurkat A3 wildtype (dark bars) and a Jurkat clone deficient in FADD (ΔFADD) (light bars) were pre-incubated for 30 min in the presence of calpeptin (20 μM), z-LLY-fmk (50 μM), and z-VAD-fmk (50 μM) prior to nsPEF treatment with ten 60 ns pulses at 60 kV/cm or sham treated. Cell lysates were prepared 3 hours post pulse, separated by SDS-PAGE like experiments shown in Figure 8C and Bid and t-Bid were quantified using Odyssey infrared imager and normalized to total Bid levels in control. Results were plotted as the percent inhibition of Bid cleavage in the absence of inhibitors. Values represent a single experiment.
Figure 10
Figure 10
A model for nsPEF-induced cell death in human Jurkat cells.

References

    1. Hanahan D., Weinberg R.A. The hallmarks of cancer. Cell. 2000;100:57–70. doi: 10.1016/S0092-8674(00)81683-9. - DOI - PubMed
    1. Hanahan D., Weinberg R.A. Hallmarks of cancer: The next generation. Cell. 2011;144:646–674. doi: 10.1016/j.cell.2011.02.013. - DOI - PubMed
    1. Loges S., Schmidt T., Carmeliet P. Mechanisms of Resistance to Anti-Angiogenic Therapy and Development of Third-Generation Anti-Angiogenic Drug Candidates. Genes Cancer. 2010;1:12–25. doi: 10.1177/1947601909356574. - DOI - PMC - PubMed
    1. Mir L.M., Orlowski S., Belehradek J., Paoletti C. Electrochemotherapy potentiation of antitumour effect of bleomycin by local electric pulses. Eur. J. Cancer. 1991;27:68–72. doi: 10.1016/0277-5379(91)90064-K. - DOI - PubMed
    1. Sersa G., Cemazar M., Miklavcic D. Antitumor effectiveness of electrochemotherapy with cis-diamminedichloroplatinum(II) in mice. Cancer Res. 1995;55:3450–3455. - PubMed