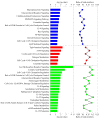
Temporal gene expression kinetics for human keratinocytes exposed to hyperthermic stress
- PMID: 24709698
- PMCID: PMC3972685
- DOI: 10.3390/cells2020224
Temporal gene expression kinetics for human keratinocytes exposed to hyperthermic stress
Abstract
The gene expression kinetics for human cells exposed to hyperthermic stress are not well characterized. In this study, we identified and characterized the genes that are differentially expressed in human epidermal keratinocyte (HEK) cells exposed to hyperthermic stress. In order to obtain temporal gene expression kinetics, we exposed HEK cells to a heat stress protocol (44 °C for 40 min) and used messenger RNA (mRNA) microarrays at 0 h, 4 h and 24 h post-exposure. Bioinformatics software was employed to characterize the chief biological processes and canonical pathways associated with these heat stress genes. The data shows that the genes encoding for heat shock proteins (HSPs) that function to prevent further protein denaturation and aggregation, such as HSP40, HSP70 and HSP105, exhibit maximal expression immediately after exposure to hyperthermic stress. In contrast, the smaller HSPs, such as HSP10 and HSP27, which function in mitochondrial protein biogenesis and cellular adaptation, exhibit maximal expression during the "recovery phase", roughly 24 h post-exposure. These data suggest that the temporal expression kinetics for each particular HSP appears to correlate with the cellular function that is required at each time point. In summary, these data provide additional insight regarding the expression kinetics of genes that are triggered in HEK cells exposed to hyperthermic stress.
Figures


Similar articles
-
T lymphocyte stress response. I. Induction of heat shock protein synthesis at febrile temperatures is correlated with enhanced resistance to hyperthermic stress but not to heavy metal toxicity or dexamethasone-induced immunosuppression.Cell Immunol. 1990 Sep;129(2):363-76. doi: 10.1016/0008-8749(90)90212-a. Cell Immunol. 1990. PMID: 2383896
-
Accumulation of heat shock protein 70 RNA and its relationship to protein synthesis after heat shock in mammalian cells.Exp Cell Res. 1987 Feb;168(2):539-45. doi: 10.1016/0014-4827(87)90026-7. Exp Cell Res. 1987. PMID: 3803453
-
Maximal eccentric exercise induces a rapid accumulation of small heat shock proteins on myofibrils and a delayed HSP70 response in humans.Am J Physiol Regul Integr Comp Physiol. 2007 Aug;293(2):R844-53. doi: 10.1152/ajpregu.00677.2006. Epub 2007 May 23. Am J Physiol Regul Integr Comp Physiol. 2007. PMID: 17522120
-
Heat shock gene expression in Xenopus laevis A6 cells in response to heat shock and sodium arsenite treatments.Biochem Cell Biol. 1988 Aug;66(8):862-70. doi: 10.1139/o88-098. Biochem Cell Biol. 1988. PMID: 3196465
-
The exercise-induced stress response of skeletal muscle, with specific emphasis on humans.Sports Med. 2009;39(8):643-62. doi: 10.2165/00007256-200939080-00003. Sports Med. 2009. PMID: 19769414 Review.
Cited by
-
Heat-mediated reduction of apoptosis in UVB-damaged keratinocytes in vitro and in human skin ex vivo.BMC Dermatol. 2016 May 26;16(1):6. doi: 10.1186/s12895-016-0043-4. BMC Dermatol. 2016. PMID: 27230291 Free PMC article.
-
UBA6 and Its Bispecific Pathways for Ubiquitin and FAT10.Int J Mol Sci. 2019 May 7;20(9):2250. doi: 10.3390/ijms20092250. Int J Mol Sci. 2019. PMID: 31067743 Free PMC article. Review.
-
Differential Temperature-Induced Responses in Immortalized Oral and Skin Keratinocytes.Int J Mol Sci. 2025 Mar 21;26(7):2851. doi: 10.3390/ijms26072851. Int J Mol Sci. 2025. PMID: 40243437 Free PMC article.
-
Structures of UBA6 explain its dual specificity for ubiquitin and FAT10.Nat Commun. 2022 Aug 15;13(1):4789. doi: 10.1038/s41467-022-32040-6. Nat Commun. 2022. PMID: 35970836 Free PMC article.
-
Heat shock proteins in the physiology and pathophysiology of epidermal keratinocytes.Cell Stress Chaperones. 2019 Nov;24(6):1027-1044. doi: 10.1007/s12192-019-01044-5. Epub 2019 Nov 16. Cell Stress Chaperones. 2019. PMID: 31734893 Free PMC article. Review.
References
-
- Wilmink G.J., Grundt J.E. Invited review article: Current state of research on biological effects of terahertz radiation. J. Infrared. Millim. Te. 2011;32:1074–1122. doi: 10.1007/s10762-011-9794-5. - DOI
-
- Wilmink G.J., Opalenik S.R., Beckham J.T., Abraham A.A., Nanney L.B., Mahadevan-Jansen A., Davidson J.M., Jansen E.D. Molecular imaging-assisted optimization of hsp70 expression during laser-induced thermal preconditioning for wound repair enhancement. J. Invest. Dermatol. 2009;129:205–216. doi: 10.1038/jid.2008.175. - DOI - PMC - PubMed
-
- Wilmink G.J., Opalenik S.R., Beckham J.T., Mackanos M.A., Nanney L.B., Contag C.H., Davidson J.M., Jansen E.D. In-vivo optical imaging of hsp70 expression to assess collateral tissue damage associated with infrared laser ablation of skin. J. Biomed. Opt. 2008;13:054066. doi: 10.1117/1.2992594. - DOI - PMC - PubMed
LinkOut - more resources
Full Text Sources
Other Literature Sources
Research Materials
Miscellaneous

