

Maximum running speed of captive bar-headed geese is unaffected by severe hypoxia
- PMID: 24710001
- PMCID: PMC3977980
- DOI: 10.1371/journal.pone.0094015
Maximum running speed of captive bar-headed geese is unaffected by severe hypoxia
Abstract
While bar-headed geese are renowned for migration at high altitude over the Himalayas, previous work on captive birds suggested that these geese are unable to maintain rates of oxygen consumption while running in severely hypoxic conditions. To investigate this paradox, we re-examined the running performance and heart rates of bar-headed geese and barnacle geese (a low altitude species) during exercise in hypoxia. Bar-headed geese (n = 7) were able to run at maximum speeds (determined in normoxia) for 15 minutes in severe hypoxia (7% O2; simulating the hypoxia at 8500 m) with mean heart rates of 466±8 beats min-1. Barnacle geese (n = 10), on the other hand, were unable to complete similar trials in severe hypoxia and their mean heart rate (316 beats.min-1) was significantly lower than bar-headed geese. In bar-headed geese, partial pressures of oxygen and carbon dioxide in both arterial and mixed venous blood were significantly lower during hypoxia than normoxia, both at rest and while running. However, measurements of blood lactate in bar-headed geese suggested that anaerobic metabolism was not a major energy source during running in hypoxia. We combined these data with values taken from the literature to estimate (i) oxygen supply, using the Fick equation and (ii) oxygen demand using aerodynamic theory for bar-headed geese flying aerobically, and under their own power, at altitude. This analysis predicts that the maximum altitude at which geese can transport enough oxygen to fly without environmental assistance ranges from 6,800 m to 8,900 m altitude, depending on the parameters used in the model but that such flights should be rare.
Conflict of interest statement
Figures
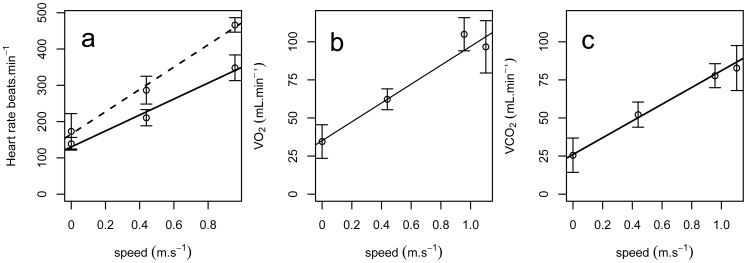
 (in mL.min−1) and Mean
  (in mL.min−1) of un-cannulated bar-headed geese against increasing treadmill speed in normoxia (solid line) and hypoxia (dashed line in part a), error bars show s.e.m.; Lines show linear models for fit, error bars show ±1 s.e.m.
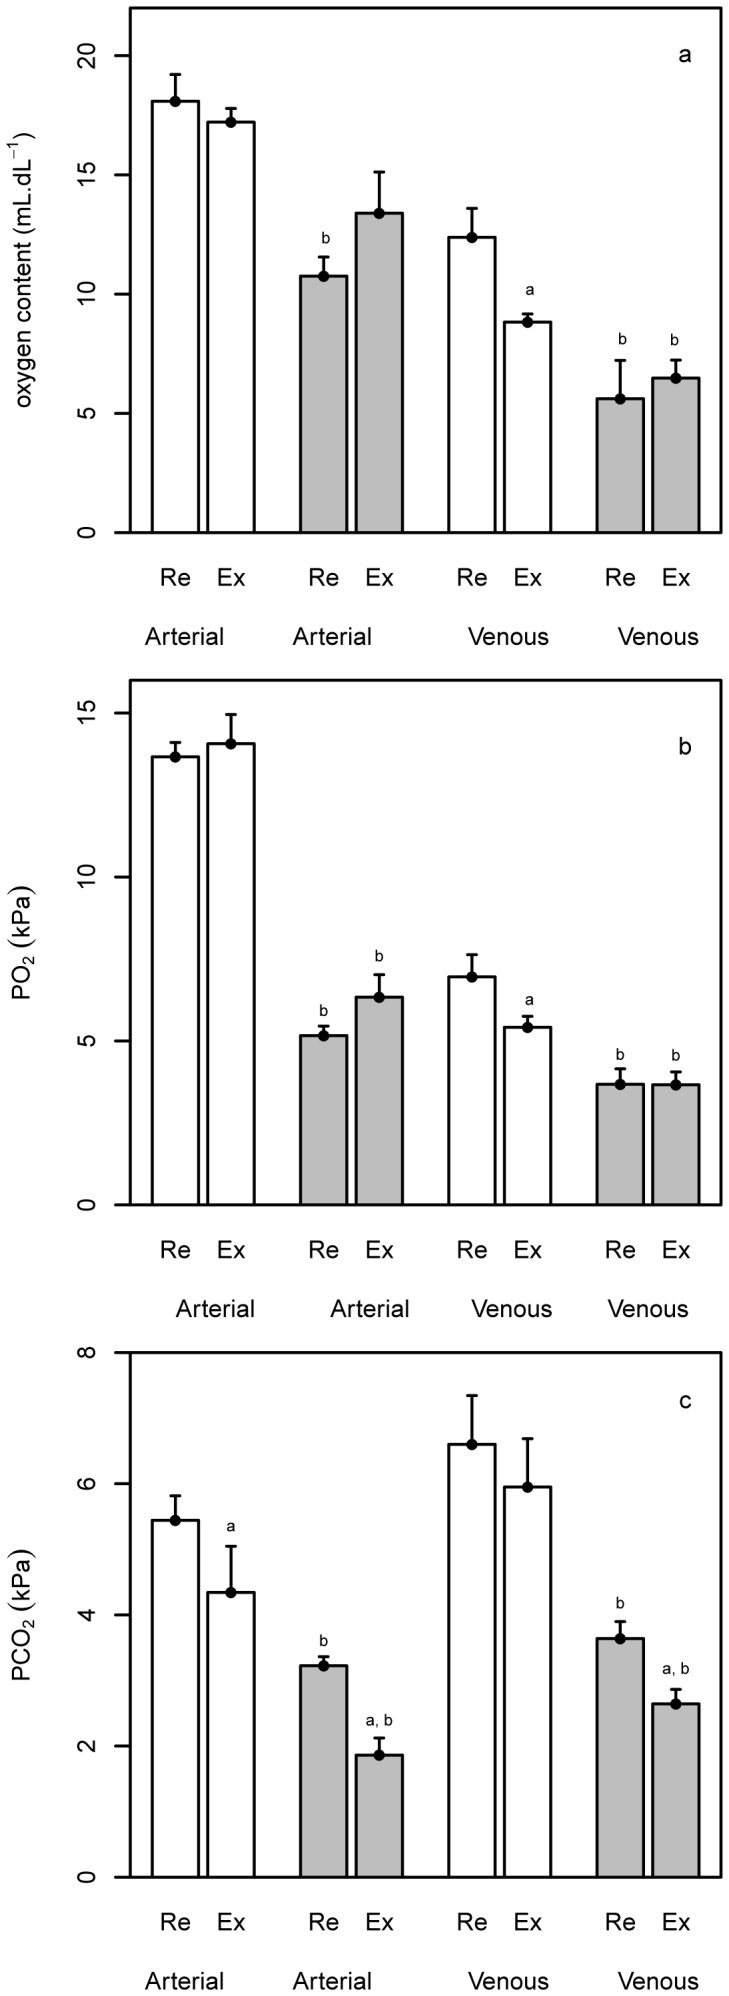
 (c) and
  for bar-headed geese. Values at rest (Re) and during running (Ex) are shown for normoxia (white bars) and severe hypoxia (7% O2; grey bars). Bars show mean values, error bars show 1 s.e.m., a = mean values are significantly different at rest, b = mean values are significantly different to normoxia, where p<0.05.
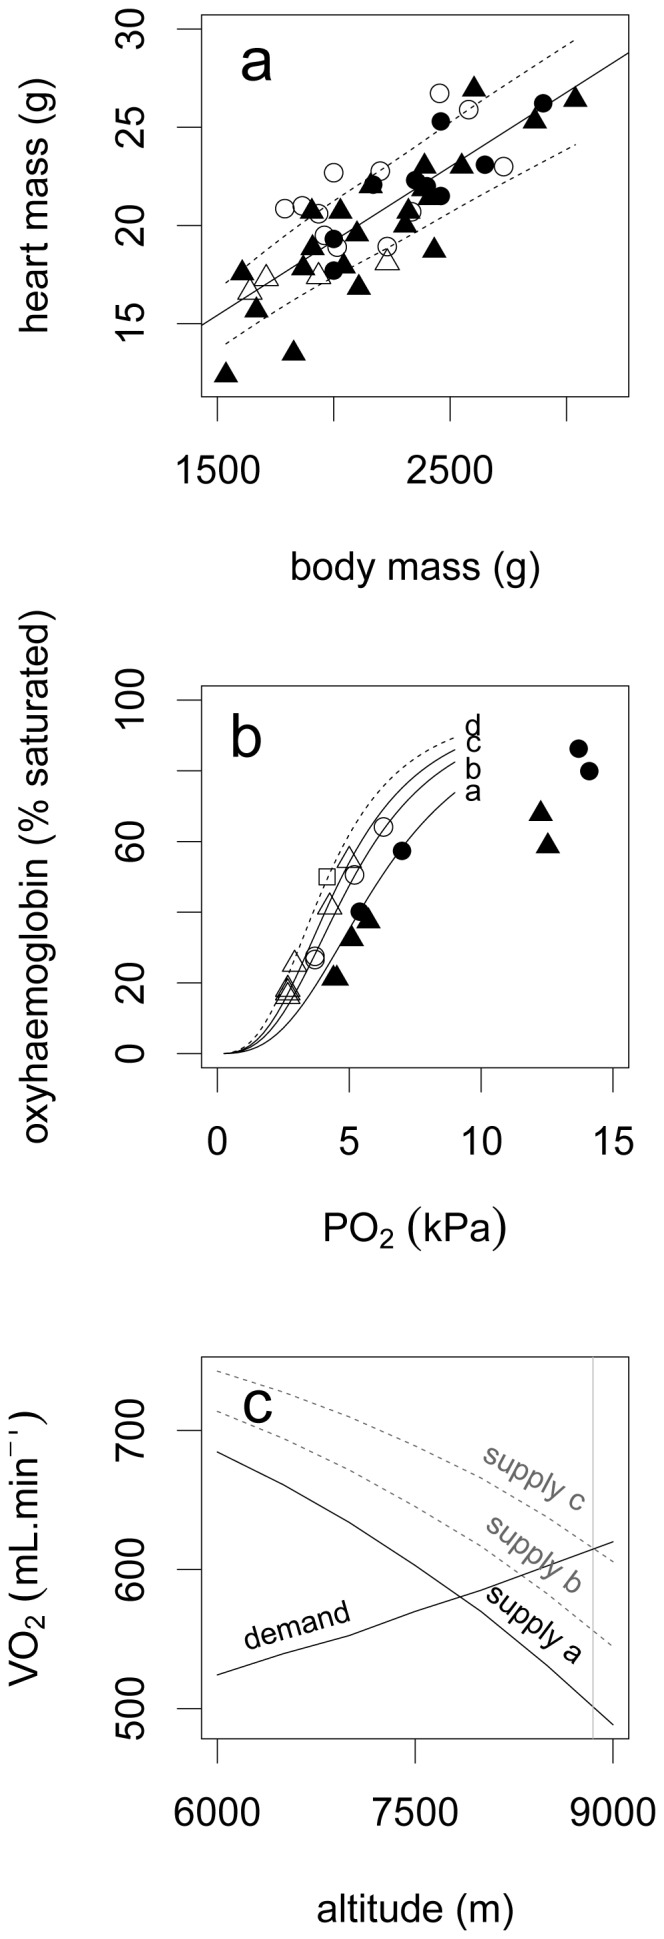
 . A curve is also fitted to in-vitro data published by Petschow et al. and Meir & Milsom (dashed line, labelled ‘d’). (c) Plot showing the modelled increases in
  demand (black line) during horizontal flight at high altitude and the reduction in potential O2 supply (one black line, two dashed grey lines) by the cardiovascular system. The supply models use the oxygen-haemoglobin dissociation curves in part b (curve a, labelled ‘supply a’; grey dashed curve b, labelled ‘supply b’ and grey dashed curve d labelled ‘supply c’). Grey vertical line approximates the summit of Mount Everest at 8,848 metres. Predicted supply crosses demand at 7,850 m (supply ‘a’), 8,300 m (supply ‘b’) and 8,900 m (supply ‘c’).
Similar articles
-
High fliers: the physiology of bar-headed geese.Comp Biochem Physiol A Mol Integr Physiol. 2010 Jul;156(3):325-9. doi: 10.1016/j.cbpa.2010.01.016. Epub 2010 Jan 28. Comp Biochem Physiol A Mol Integr Physiol. 2010. PMID: 20116442
-
Altitude matters: differences in cardiovascular and respiratory responses to hypoxia in bar-headed geese reared at high and low altitudes.J Exp Biol. 2016 Jul 1;219(Pt 13):1974-84. doi: 10.1242/jeb.132431. J Exp Biol. 2016. PMID: 27385754
-
Do Bar-Headed Geese Train for High Altitude Flights?Integr Comp Biol. 2017 Aug 1;57(2):240-251. doi: 10.1093/icb/icx068. Integr Comp Biol. 2017. PMID: 28859401
-
How bar-headed geese fly over the Himalayas.Physiology (Bethesda). 2015 Mar;30(2):107-15. doi: 10.1152/physiol.00050.2014. Physiology (Bethesda). 2015. PMID: 25729056 Free PMC article. Review.
-
High-altitude champions: birds that live and migrate at altitude.J Appl Physiol (1985). 2017 Oct 1;123(4):942-950. doi: 10.1152/japplphysiol.00110.2017. Epub 2017 Aug 24. J Appl Physiol (1985). 2017. PMID: 28839002 Free PMC article. Review.
Cited by
-
Evolutionary ecophysiology in extreme environments under a global change scenario.Conserv Physiol. 2025 Aug 11;13(1):coaf059. doi: 10.1093/conphys/coaf059. eCollection 2025. Conserv Physiol. 2025. PMID: 40799845 Free PMC article.
-
Costs of locomotion in polar bears: when do the costs outweigh the benefits of chasing down terrestrial prey?Conserv Physiol. 2016 Oct 15;4(1):cow045. doi: 10.1093/conphys/cow045. eCollection 2016. Conserv Physiol. 2016. PMID: 27757238 Free PMC article.
-
The physiological basis of bird flight.Philos Trans R Soc Lond B Biol Sci. 2016 Sep 26;371(1704):20150384. doi: 10.1098/rstb.2015.0384. Philos Trans R Soc Lond B Biol Sci. 2016. PMID: 27528774 Free PMC article. Review.
-
Fusion of wildlife tracking and satellite geomagnetic data for the study of animal migration.Mov Ecol. 2021 Jun 11;9(1):31. doi: 10.1186/s40462-021-00268-4. Mov Ecol. 2021. PMID: 34116722 Free PMC article.
-
Fuel metabolism in Canada geese: effects of glucagon on glucose kinetics.Am J Physiol Regul Integr Comp Physiol. 2015 Sep;309(5):R535-43. doi: 10.1152/ajpregu.00080.2015. Epub 2015 Jun 24. Am J Physiol Regul Integr Comp Physiol. 2015. PMID: 26108869 Free PMC article.
References
-
- Bishop M, Yanling S, Zhouma C, Binyuan G (1997) Bar-headed geese Anser indicus wintering in south-central Tibet. Wildfowl 48: 118–126.
-
- Butler PJ, Woakes AJ, Bishop CM (1998) Behaviour and physiology of Svalbard barnacle geese Branta leucopsis during their autumn migration. Journal of Avian Biology 29: 536–545.
Publication types
MeSH terms
Grants and funding
LinkOut - more resources
Full Text Sources
Other Literature Sources
Miscellaneous
