

Measuring turnover of SIV DNA in resting CD4+ T cells using pyrosequencing: implications for the timing of HIV eradication therapies
- PMID: 24710023
- PMCID: PMC3977820
- DOI: 10.1371/journal.pone.0093330
Measuring turnover of SIV DNA in resting CD4+ T cells using pyrosequencing: implications for the timing of HIV eradication therapies
Abstract
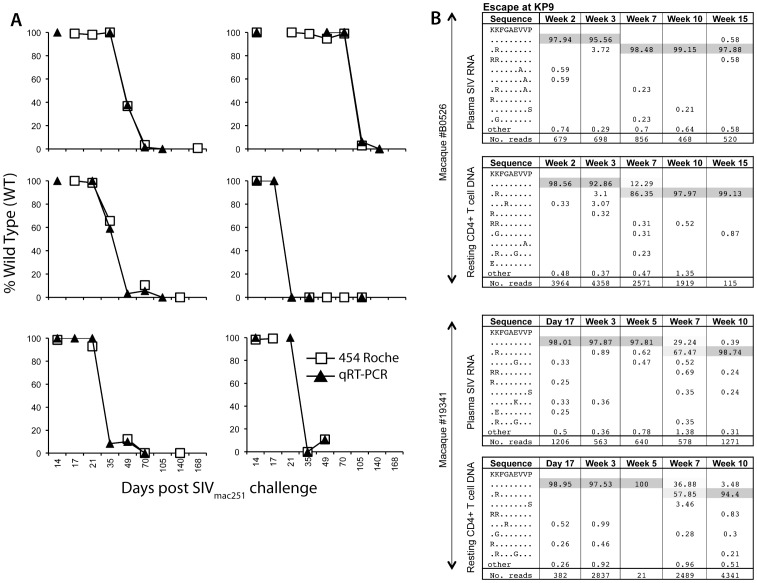
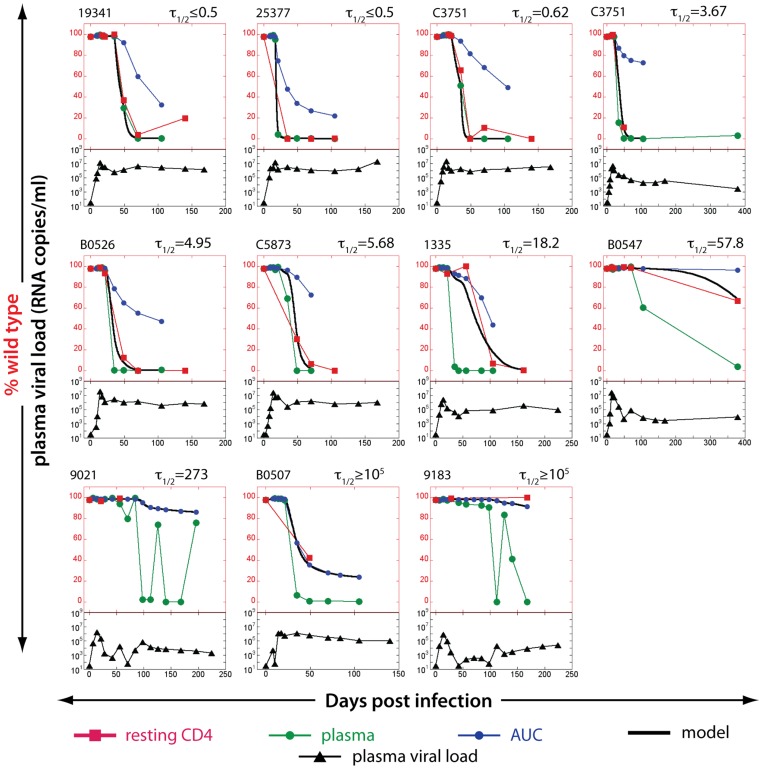
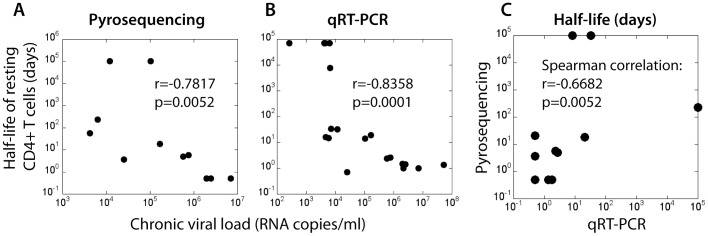
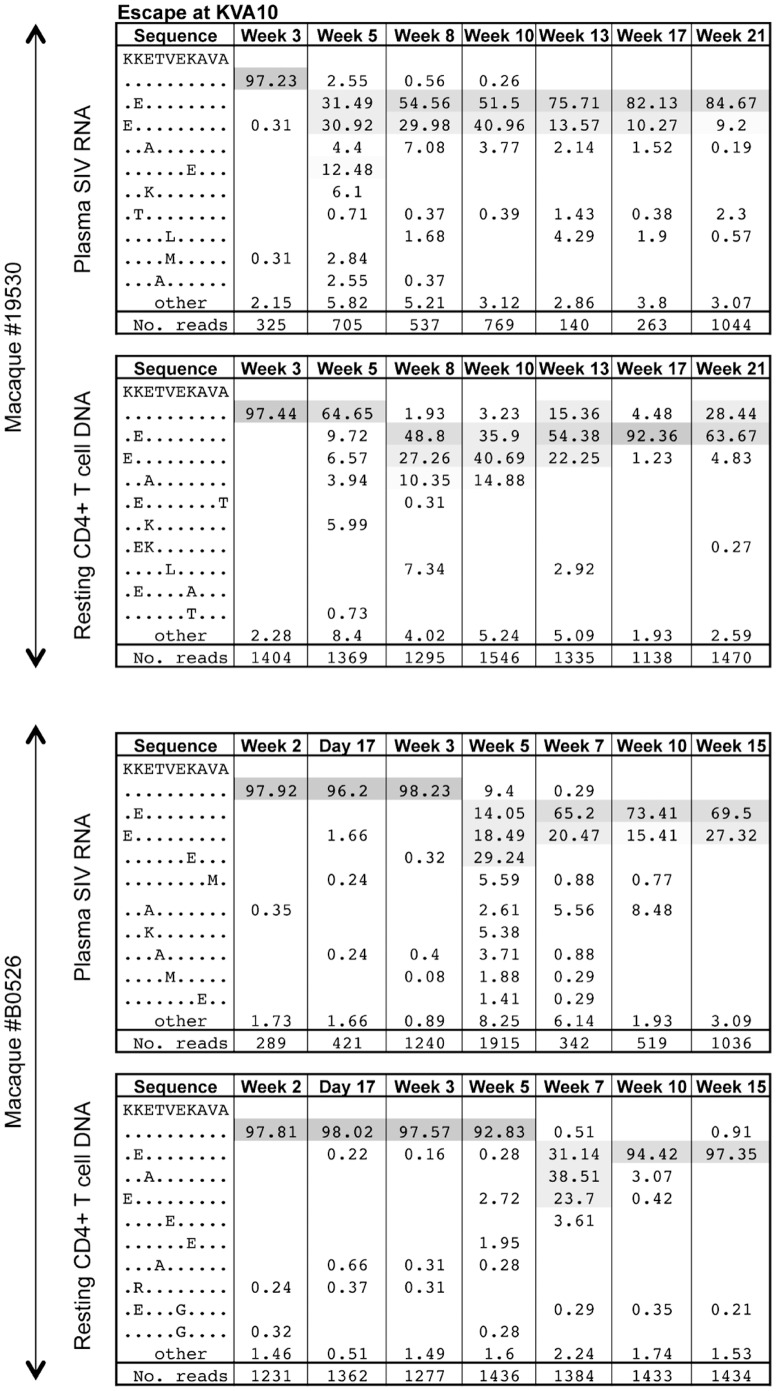
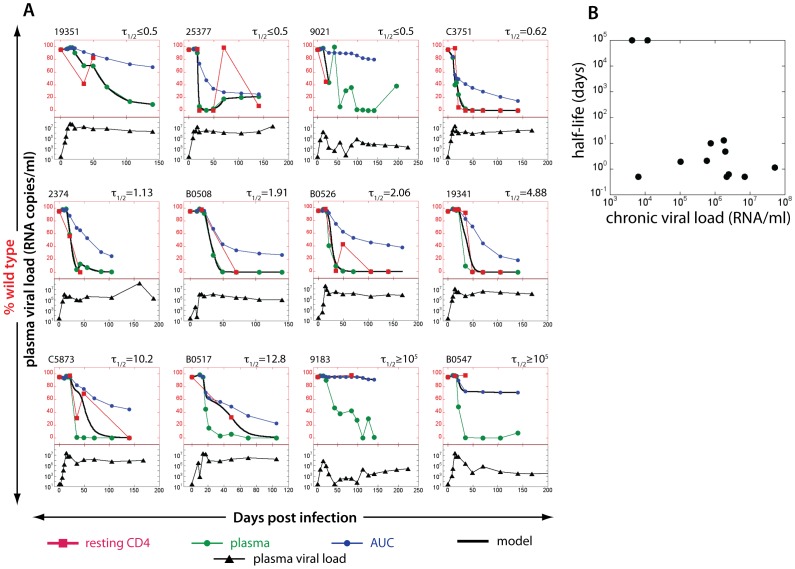
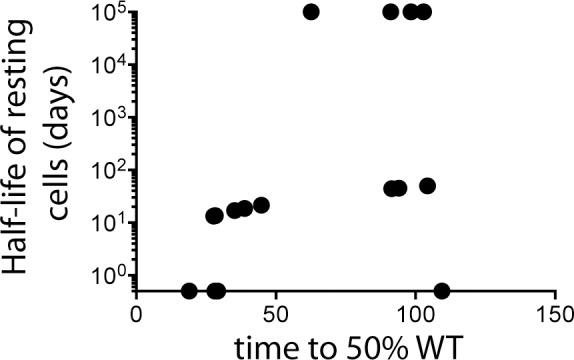
Resting CD4+ T cells are a reservoir of latent HIV-1. Understanding the turnover of HIV DNA in these cells has implications for the development of eradication strategies. Most studies of viral latency focus on viral persistence under antiretroviral therapy (ART). We studied the turnover of SIV DNA resting CD4+ T cells during active infection in a cohort of 20 SIV-infected pigtail macaques. We compared SIV sequences at two Mane-A1*084:01-restricted CTL epitopes using serial plasma RNA and resting CD4+ T cell DNA samples by pyrosequencing, and used a mathematical modeling approach to estimate SIV DNA turnover. We found SIV DNA turnover in resting CD4+ T cells was slow in animals with low chronic viral loads, consistent with the long persistence of latency seen under ART. However, in animals with high levels of chronic viral replication, turnover was high. SIV DNA half-life within resting CD4 cells correleated with viral load (p = 0.0052) at the Gag KP9 CTL epitope. At a second CTL epitope in Tat (KVA10) there was a trend towards an association of SIV DNA half-life in resting CD4 cells and viral load (p = 0.0971). Further, we found that the turnover of resting CD4+ T cell SIV DNA was higher for escape during early infection than for escape later in infection (p = 0.0084). Our results suggest viral DNA within resting CD4 T cells is more labile and may be more susceptible to reactivation/eradication treatments when there are higher levels of virus replication and during early/acute infection.
Conflict of interest statement
Figures
Similar articles
-
An "escape clock" for estimating the turnover of SIV DNA in resting CD4⁺ T cells.PLoS Pathog. 2012;8(4):e1002615. doi: 10.1371/journal.ppat.1002615. Epub 2012 Apr 5. PLoS Pathog. 2012. PMID: 22496643 Free PMC article.
-
Resting CD4+ T lymphocytes but not thymocytes provide a latent viral reservoir in a simian immunodeficiency virus-Macaca nemestrina model of human immunodeficiency virus type 1-infected patients on highly active antiretroviral therapy.J Virol. 2003 Apr;77(8):4938-49. doi: 10.1128/jvi.77.8.4938-4949.2003. J Virol. 2003. PMID: 12663799 Free PMC article.
-
Antibody-Mediated CD4 Depletion Induces Homeostatic CD4+ T Cell Proliferation without Detectable Virus Reactivation in Antiretroviral Therapy-Treated Simian Immunodeficiency Virus-Infected Macaques.J Virol. 2018 Oct 29;92(22):e01235-18. doi: 10.1128/JVI.01235-18. Print 2018 Nov 15. J Virol. 2018. PMID: 30185596 Free PMC article.
-
HIV Persistence in Adipose Tissue Reservoirs.Curr HIV/AIDS Rep. 2018 Feb;15(1):60-71. doi: 10.1007/s11904-018-0378-z. Curr HIV/AIDS Rep. 2018. PMID: 29423731 Free PMC article. Review.
-
SIV Latency in Macrophages in the CNS.Curr Top Microbiol Immunol. 2018;417:111-130. doi: 10.1007/82_2018_89. Curr Top Microbiol Immunol. 2018. PMID: 29770863 Free PMC article. Review.
Cited by
-
Early intervention with 3BNC117 and romidepsin at antiretroviral treatment initiation in people with HIV-1: a phase 1b/2a, randomized trial.Nat Med. 2022 Nov;28(11):2424-2435. doi: 10.1038/s41591-022-02023-7. Epub 2022 Oct 17. Nat Med. 2022. PMID: 36253609 Free PMC article. Clinical Trial.
-
Challenges and Opportunities for T-Cell-Mediated Strategies to Eliminate HIV Reservoirs.Front Immunol. 2015 Oct 2;6:506. doi: 10.3389/fimmu.2015.00506. eCollection 2015. Front Immunol. 2015. PMID: 26483795 Free PMC article. Review.
-
Visualizing the Immune System: Providing Key Insights into HIV/SIV Infections.Front Immunol. 2018 Mar 2;9:423. doi: 10.3389/fimmu.2018.00423. eCollection 2018. Front Immunol. 2018. PMID: 29552017 Free PMC article. Review.
-
Between a shock and a hard place: challenges and developments in HIV latency reversal.Curr Opin Virol. 2019 Oct;38:1-9. doi: 10.1016/j.coviro.2019.03.004. Epub 2019 Apr 29. Curr Opin Virol. 2019. PMID: 31048093 Free PMC article. Review.
-
Impact of the initial administration of an antiretroviral drug with latency reversal properties on the HIV reservoir size.Sci Rep. 2025 Jul 13;15(1):25306. doi: 10.1038/s41598-025-09474-1. Sci Rep. 2025. PMID: 40653494 Free PMC article.
References
-
- Lewden C, Bouteloup V, De Wit S, Sabin C, Mocroft A, et al. (2012) All-cause mortality in treated HIV-infected adults with CD4>/ = 500/mm3 compared with the general population: evidence from a large European observational cohort collaboration. Int J Epidemiol 41: 433–445. - PubMed
-
- Finzi D, Blankson J, Siliciano JD, Margolick JB, Chadwick K, et al. (1999) Latent infection of CD4+ T cells provides a mechanism for lifelong persistence of HIV-1, even in patients on effective combination therapy. Nature medicine 5: 512–517. - PubMed
-
- Chun TW, Carruth L, Finzi D, Shen X, DiGiuseppe JA, et al. (1997) Quantification of latent tissue reservoirs and total body viral load in HIV-1 infection. Nature 387: 183–188. - PubMed
-
- Wong JK, Hezareh M, Gunthard HF, Havlir DV, Ignacio CC, et al. (1997) Recovery of replication-competent HIV despite prolonged suppression of plasma viremia. Science 278: 1291–1295. - PubMed
Publication types
MeSH terms
Substances
Grants and funding
LinkOut - more resources
Full Text Sources
Other Literature Sources
Medical
Research Materials
