. 2014 Apr 7:5:3592.
doi: 10.1038/ncomms4592.

Methionine restriction extends lifespan of Drosophila melanogaster under conditions of low amino-acid status

Affiliations

Methionine restriction extends lifespan of Drosophila melanogaster under conditions of low amino-acid status

Byung Cheon Lee et al. Nat Commun. .

Abstract

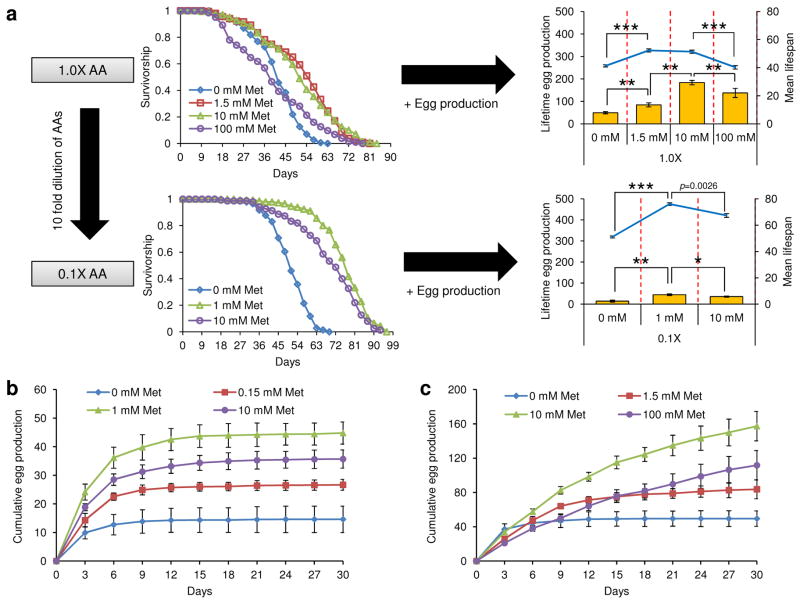
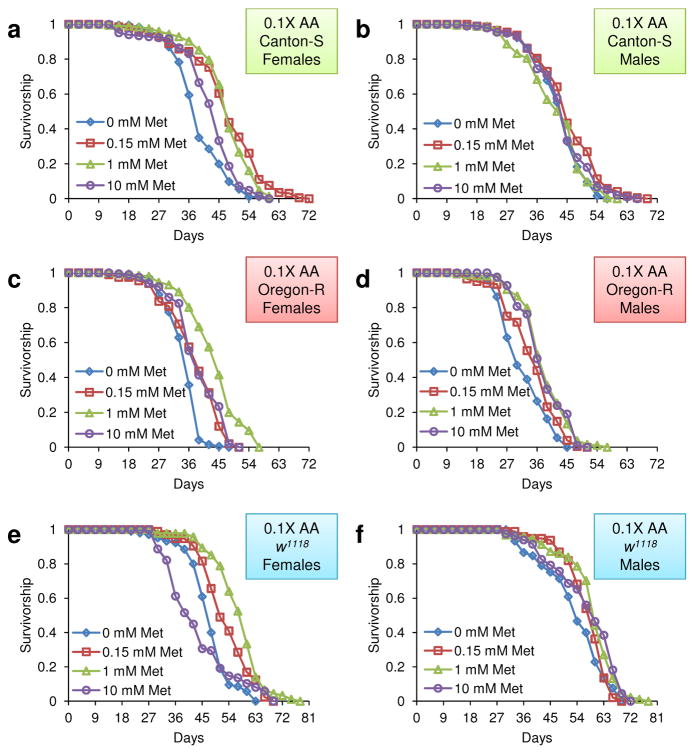
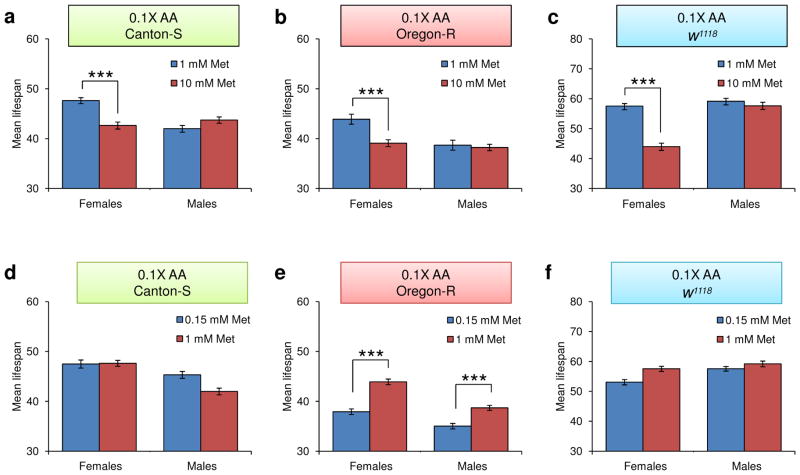
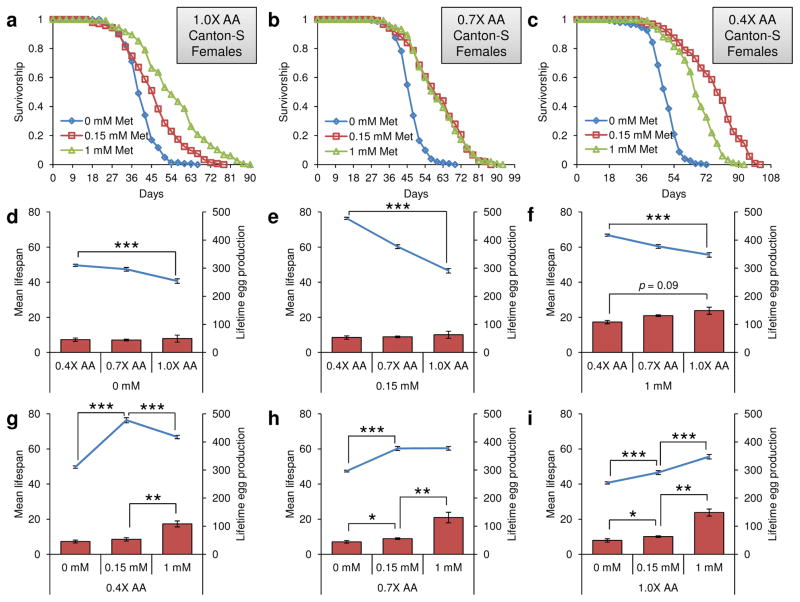
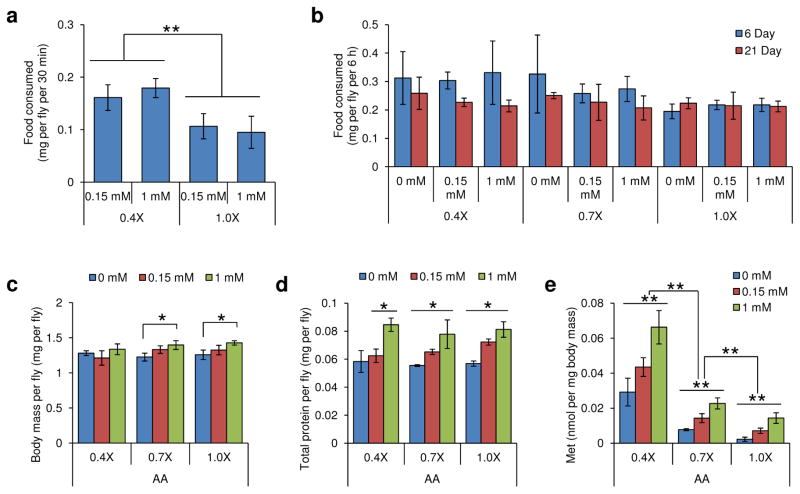
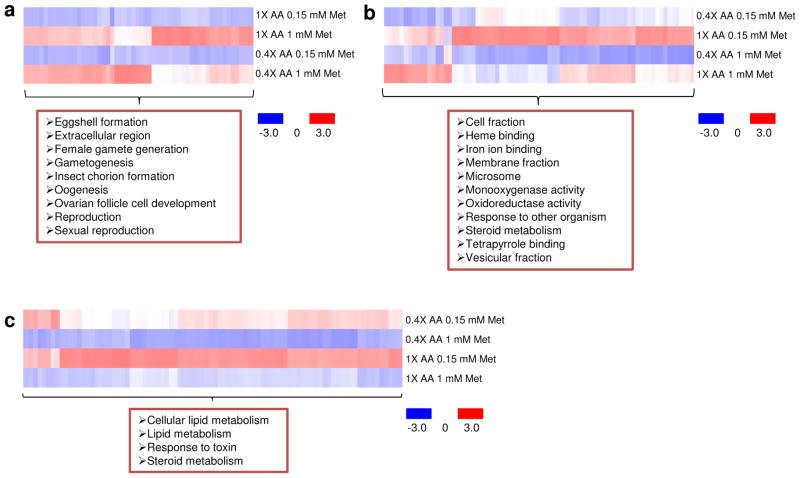
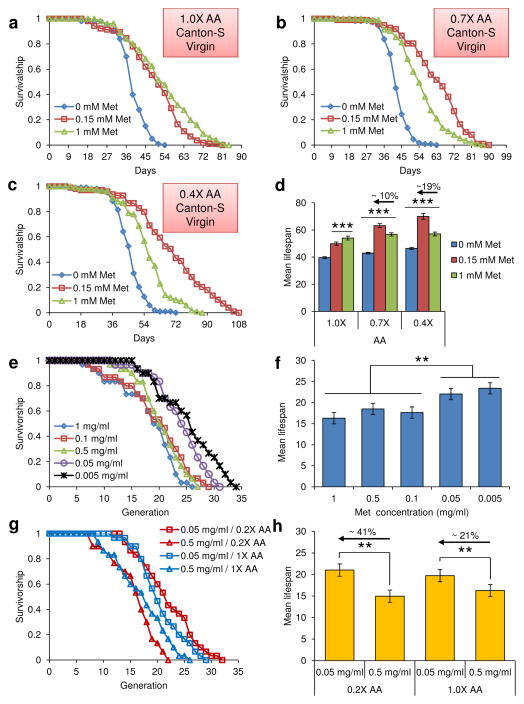
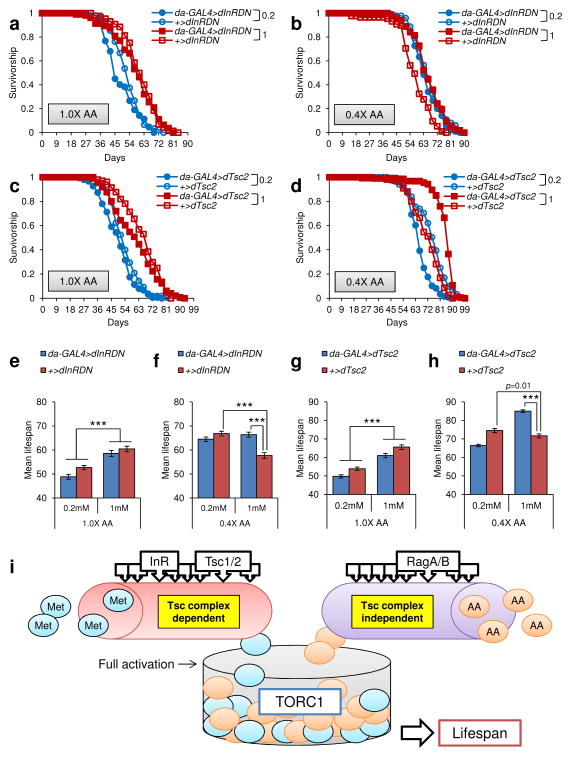
Reduced methionine (Met) intake can extend lifespan of rodents; however, whether this regimen represents a general strategy for regulating aging has been controversial. Here we report that Met restriction extends lifespan in both fruit flies and yeast, and that this effect requires low amino-acid status. Met restriction in Drosophila mimicks the effect of dietary restriction and is associated with decreased reproduction. However, under conditions of high amino-acid status, Met restriction is ineffective and the trade-off between longevity and reproduction is not observed. Overexpression of InRDN or Tsc2 inhibits lifespan extension by Met restriction, suggesting the role of TOR signalling in the Met control of longevity. Overall, this study defines the specific roles of Met and amino-acid imbalance in aging and suggests that Met restiction is a general strategy for lifespan extension.


Conflict of interest statement

COMPETING FINANCIAL INTERESTS

The authors declare that no competing financial interests exist.

Figures

Figure 1
Figure 1
Imbalance of amino acids and high levels of Met decrease lifespan and reproduction. a) Survivorship curve, mean lifespan, and lifetime eggs production of mated female Canton-S flies reared on the 0.1X or 1.0X amino acids diets containing 0, 1, 1.5, 10, or 100 mM Met were analyzed. Bar graphs show lifetime egg production (left axis) (mean±s.d., n = 40, *: p<0.05, **: p<0.01, Student’s t-test) and line graphs mean lifespan (right axis) (mean±s.e.m., n = 144 ~ 205, ***: p<0.0001, Log-rank test). See Supplementary Tables 1 and 2 for n number and statistics of individual dietary groups. b) Cumulative eggs production of mated female Canton-S flies reared on the 0.1X diet containing 0, 0.15, 1, or 10 mM Met for 30 days (mean±s.d., n =40). c) Cumulative eggs production of mated female Canton-S flies reared on the 1.0X diet containing 0, 1.5, 10, or 100 mM Met for 30 days (mean±s.d., n = 30).
Figure 2
Figure 2
Survivorship curves of fruit flies reared on the 0.1X diet varying in Met levels. a) Female Canton-S flies, b) male Canton-S flies, c) female Oregon-R flies, d) male Oregon-R flies, e) female w1118 flies and f) male w1118 flies were reared on the 0.1X diet containing 0 mM, 0.15 mM, 1 mM, or 10 mM Met are shown in the survivorship curves.
Figure 3
Figure 3
Sex-specific decrease of lifespan by imbalance of amino acids and high levels of Met. a–c) Female and male Canton-S, Oregon-R, and w1118 flies reared on the 0.1X diet containing 1 or 10 mM Met. a) Canton-S (mean±s.e.m., n = 184 ~ 196), b) Oregon-R (mean±s.e.m., n = 198 ~ 206), and c) w1118 (mean±s.e.m., n = 81 ~ 94) flies were analyzed for mean lifespan and examined for differences among dietary groups (***: p<0.0001, Log-rank test). d–f) Female and male Canton-S, Oregon-R, and w1118 flies reared on the 0.1X diet containing 0.15 or 1 mM Met. d) Canton-S (mean±s.e.m., n = 187 ~ 196), e) Oregon-R (mean±s.e.m., n = 198 ~ 203), and f) w1118 (mean±s.e.m., n = 91 ~ 99) flies were analyzed for mean lifespan and analyzed for differences among dietary groups (***: p<0.0001, Log-rank test). See Supplementary Table 3 for n number and statistics of individual strains and dietary group.
Figure 4
Figure 4
Lifespan extension of mated female flies by Met restriction and low amino acids. a–c) Survivorship curves of mated female Canton-S flies reared on a) 1.0X diet containing 0, 0.15, or 1 mM Met, b) 0.7X diet containing 0, 0.15, or 1 mM Met, or c) 0.4X diet containing 0, 0.15, or 1 mM Met, are shown. Mean lifespan and lifetime eggs production of mated female Canton-S flies on d) 0.4X, 0.7X, or 1.0X diets containing 0 mM Met (mean lifespan: mean±s.e.m., n = 134 ~ 151, ***: p<0.0001, Log-rank test) (Lifetime eggs production: mean±s.d., n = 40, *: p<0.05, **: p<0.01, Student’s t-test), e) 0.4X, 0.7X, or 1.0X diets containing 0.15 mM Met (mean lifespan: mean±s.e.m., n = 123 ~ 150, ***: p<0.0001, Log-rank test) (Lifetime eggs production: mean±s.d., n = 40, *: p<0.05, **: p<0.01, Student’s t-test), f) 0.4X, 0.7X, or 1.0X diets containing 1 mM Met (mean lifespan: mean±s.e.m., n = 144 ~ 150, ***: p<0.0001, Log-rank test) (Lifetime eggs production: mean±s.d., n = 40, *: p<0.05, **: p<0.01, Student’s t-test), g) 0.4X diet containing 0, 0.15, or 1 mM Met (mean lifespan: mean±s.e.m., n = 123 ~ 150, ***: p<0.0001, Log-rank test) (Lifetime eggs production: mean±s.d., n = 40, *: p<0.05, **: p<0.01, Student’s t-test), h) 0.7X diet containing 0, 0.15, or 1 mM Met (mean lifespan: mean±s.e.m., n = 150 ~ 151, ***: p<0.0001, Log-rank test) (Lifetime eggs production: mean±s.d., n = 40, *: p<0.05, **: p<0.01, Student’s t-test), i) 1.0X diet containing 0, 0.15, or 1 mM Met (mean lifespan: mean±s.e.m., n = 134 ~ 144, ***: p<0.0001, Log-rank test) (Lifetime eggs production: mean±s.d., n = 40, *: p<0.05, **: p<0.01, Student’s t-test), are shown. Bar graphs show lifetime egg production (right axis) and line graphs mean lifespan (left axis). See Supplementary Tables 4–6 for n number and statistics of individual dietary groups.
Figure 5
Figure 5
Analysis of eating behavior and endogenous Met concentration of mated female flies. a–e) Flies were reared on 0.4X, 0.7X, or 1.0X diets containing 0, 0.15, or 1 mM Met, and then collected on 6th or 21st days. a) Food consumption for 30 min on the 6th day (mean±s.d., n = 100) and b) food consumption for 6 hours on the 6th and 21st days (mean±s.d., n = 20) were analyzed via a feeding assay using erioglaucine. c) Body mass (per fly) (mean±s.d., n = 75), d) Total protein (per fly) (mean±s.d., n = 75), e) Amounts of endogenous Met normalized to body mass (mean±s.d., n = 75) were analyzed on the 21st day. All experiments were repeated three to ten times independently and statistics was assessed by using Student’s t-test (*: p<0.05 and **: p<0.01).
Figure 6
Figure 6
Gene clusters whose expression is regulated by Met restriction and amino acid levels. a–c) Mated female Canton-S flies (n = 30) were raised on the 0.4X amino acid diet containing 0.15 mM or 1 mM Met, or the 1X amino acid diet containing 0.15 mM or 1 mM Met for 18 days, and gene expression was examined by microarray analyses. a) Gene clusters, whose expression was reduced by Met restriction in both amino acid diets, and b) decreased by low levels of amino acids in both Met diets are shown. c) Gene clusters that were upregulated by Met restriction in both amino acid diets are shown.
Figure 7
Figure 7
Lifespan extension of virgin female flies and yeast by Met restriction. a–c) Survivorship curves of virgin Canton-S flies reared on a) 0.4X diet containing 0, 0.15, or 1 mM Met, b) 0.7X diet containing 0, 0.15, or 1 mM Met, or c) 1.0X diet containing 0, 0.15, or 1 mM Met, are shown. d) Mean lifespan of virgin flies on these diets was compared (mean±s.e.m., n = 92 ~ 111, ***: p<0.0001, Log-rank test). See Supplementary Tables 8 and 9 for n number and statistics of individual dietary groups. e) Survivorship curves and f) mean lifespan of yeast grown on defined medium containing 1, 0.1, 0.5, 0.05, or 0.005 mg/ml Met (mean±s.e.m., n = 30, **: p<0.01, Rank-sum test). g) Survivorship curve and h) mean lifespan of yeast grown on defined media containing 0.5 or 0.05 mg/ml Met under conditions of 0.2X or 1.0X amino acid status (mean±s.e.m., n = 30, **: p<0.01, Rank-sum test ). See Supplementary Tables 10 and 11 for statistics of individual dietary groups.
Figure 8
Figure 8
Role of TOR signaling in lifespan extension by Met restriction. a–d) Survivorship curves of da-GAL4>dInRDN and +>dInRDN reared on a) 1.0X diet containing 0.2 or 1 mM Met, b) 0.4X diet containing 0.2 or 1 mM Met. Survivorship curves of da-GAL4>dTsc2 and +>dTsc2 reared on c) 1.0X diet containing 0.2 or 1 mM Met, d) 0.4X diet containing 0.2 or 1 mM Met. 0.2 and 1 correspond to 0.2 mM Met and 1 mM Met, respectively. e–f) Mean lifespan of da-GAL4>dInRDN and +>dInRDN reared on e) 1.0X diet containing 0.2 or 1 mM Met (mean±s.e.m., n = 81 ~ 106, ***: p<0.0001, Log-rank test), f) 0.4X diet containing 0.2 or 1 mM Met (mean±s.e.m., n = 88 ~ 106, ***: p<0.0001, Log-rank test). g–h) Mean lifespan of da-GAL4>dTsc2 and +>dTsc2 reared on g) 1.0X diet containing 0.2 or 1 mM Met (mean±s.e.m., n = 104 ~ 149, ***: p<0.0001, Log-rank test), h) 0.4X diet containing 0.2 or 1 mM Met (mean±s.e.m., n = 111 ~ 152, ***: p<0.0001, Log-rank test). See Supplementary Tables 12 and13 for n number and statistics of individual strains and dietary groups. i) Model of TORC1 activation by Met and amino acids.

References

    1. Fernandes G, Yunis EJ, Good RA. Influence of diet on survival of mice. Proc Natl Acad Sci U S A. 1976;73:1279–1283. - PMC - PubMed
    1. Bosshardt DK, Paul WJ. Caloric restriction and protein metabolism in the growing mouse. J Nutr. 1948;36:773–783. - PubMed
    1. Koubova J, Guarente L. How does calorie restriction work? Genes Dev. 2003;17:313–321. - PubMed
    1. Lakowski B, Hekimi S. The genetics of caloric restriction in Caenorhabditis elegans. Proc Natl Acad Sci U S A. 1998;95:13091–13096. - PMC - PubMed
    1. Lin SJ, et al. Calorie restriction extends Saccharomyces cerevisiae lifespan by increasing respiration. Nature. 2002;418:344–348. - PubMed

Publication types