. 2010 Dec 15;1(3):505-20.
doi: 10.3390/genes1030505.

Synaptonemal complex length variation in wild-type male mice

Affiliations

Synaptonemal complex length variation in wild-type male mice

Neil M Vranis et al. Genes (Basel). .

Abstract

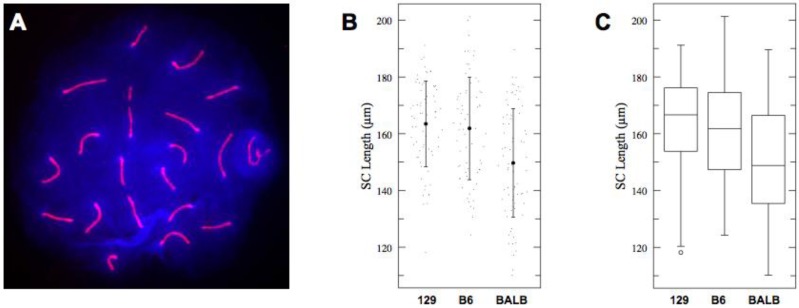
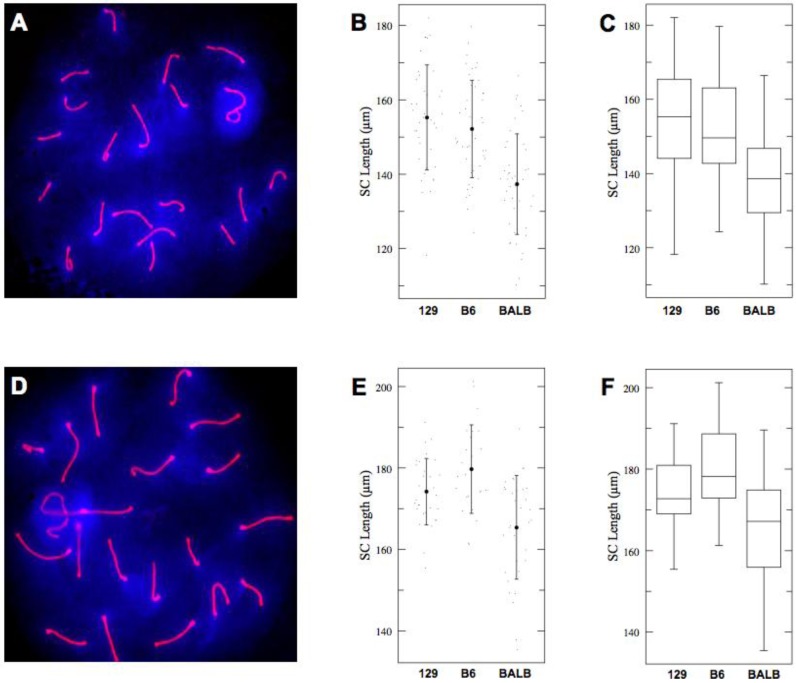
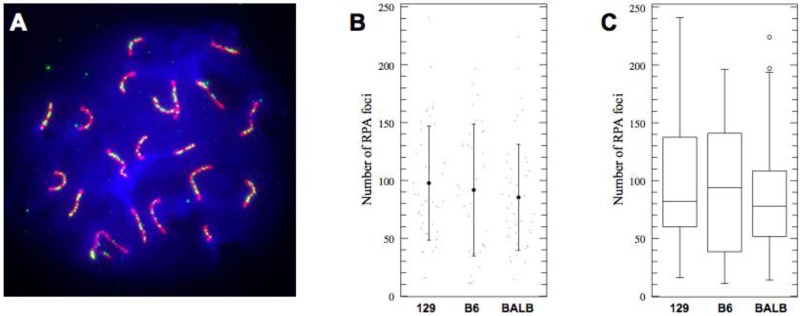
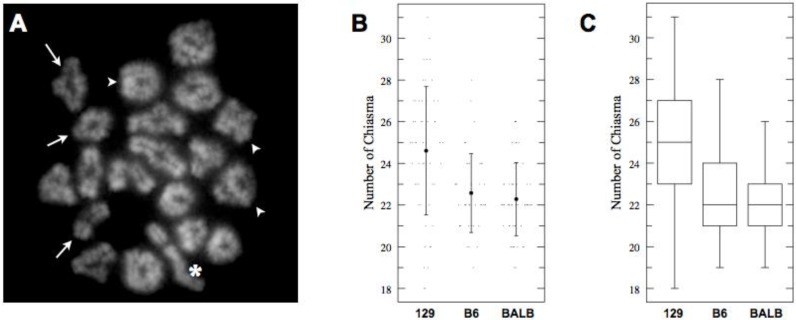
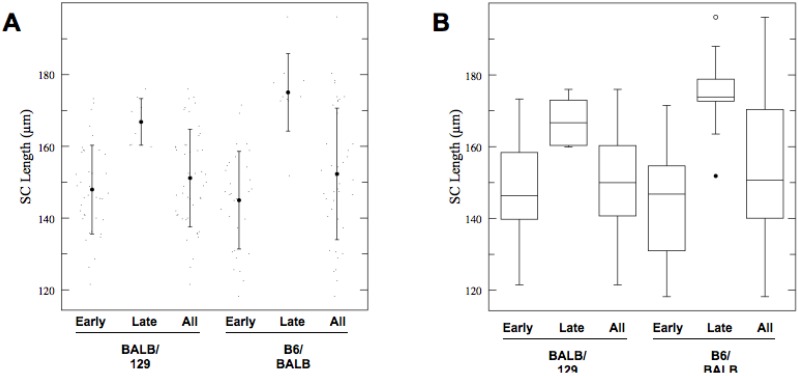
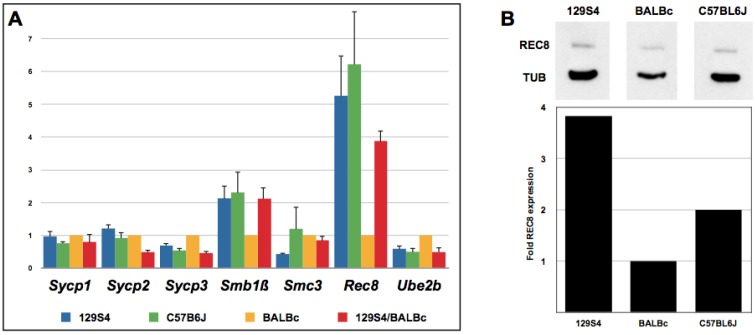
Meiosis yields haploid gametes following two successive divisions of a germ cell in the absence of intervening DNA replication. Balanced segregation of homologous chromosomes in Meiosis I is aided by a proteinaceous structure, the synaptonemal complex (SC). The objective of this study was to determine total average autosomal SC lengths in spermatocytes in three commonly used mouse strains (129S4/SvJae, C57BL/6J, and BALB/c). Our experiments revealed that the total autosomal SC length in BALB/c spermatocytes is 9% shorter than in the two other strains. Shorter SCs are also observed in spermatocytes of (BALB/c × 129S4/SvJae) and (C57BL/6J × BALB/c) F1 hybrids suggesting a genetic basis of SC length regulation. Along these lines, we studied expression of a selected group of genes implicated in meiotic chromosome architecture. We found that BALB/c testes express up to 6-fold less of Rec8 mRNA and 4-fold less of REC8 protein. These results suggest that the mechanism that defines the SC length operates via a REC8‑dependent process. Finally, our results demonstrate that genetic background can have an effect on meiotic studies in mice.


Figures

Figure 1
Figure 1
(A) Immunofluorescent detection of meiotic chromosome cores (synaptonemal complexes) with anti-SYCP2 antibody (red). Sex chromosomes occupy a separate nuclear territory (the sex body; since synapsis is limited only to the PAR and occurs at late pachytene). The remaining 19 autosomal bivalents exhibit complete synapsis. Genomic DNA was detected with DAPI (blue); (B) Total length of autosomal SCs of 129S4/SvJae, C57BL/6J and BALB/c spermatocytes. Shown are actual values (dots), mean values (solid circles) of SC lengths with one standard deviation (whiskers); (C) Box-plot representation of SCs lengths in populations of 129S4/SvJae, C57BL/6J and BALB/c spermatocytes. Shown are median, interquartile range (IQR), whiskers correspond to maximal and minimal data. When suspected outliers are present (unfilled circle in 129S4/SvJae sample) whiskers correspond to 1.5 IQR.
Figure 2
Figure 2
(A), (D) Examples of “Early” (A) and “Late” (D) pachytene spermatocytes. Red–SYCP2, blue–DAPI; (B), (E) Total lengths of autosomal SCs in “Early” (B) and “Late” (E) pachytene spermatocytes of three genetics backgrounds. Shown are actual values (dots), mean values (solid circles) of SC lengths with one standard deviation (whiskers); (C), (F) Box-plot representation of cumulative length of autosomal SCs in “Early” (C) and “Late” (F) pachytene spermatocytes. Shown are median, IQR, maximal and minimal data points.
Figure 3
Figure 3
(A) Example of RPA localization in “early” pachytene spermatocyte; (B) The number of RPA foci does not vary significantly between three pure strains (actual values, mean, and 1 SD shown); (C) Box-plot representation of RPA foci distribution in three inbred strains. Shown are median, interquartile range (IQR), whiskers correspond to maximal and minimal data.
Figure 4
Figure 4
(A) Example of Metaphase I spermatocyte (129S4/SvJae). Examples of single and double crossovers are indicated with arrows and arrowheads, respectively. Sex chromosomes are marked with an asterisk; (B) Actual values (dots) and mean number of chiasmata observed in Metaphase I spermatocytes in three strains. In contrast to the results of total autosomal SC length measurements, C57BL/6J and BALB/c spermatocytes possess close numbers of crossovers; (C) Box-plot of observed chiasma numbers in three pure strains. Shown are median, interquartile range (IQR), whiskers correspond to maximal and minimal data.
Figure 5
Figure 5
(A) Average length of total autosomal SCs in “Early” and “Late” spermatocytes from (BALB/c × 129S4/SvJae) F1 and (C57BL/6J × BALB/c) F1 animals. Shown are actual values (dots), mean values (solid circles) of SC lengths with one standard deviation (whiskers); (B) Box-plot representation of the data. Shown are median, interquartile range (IQR), whiskers correspond to maximal and minimal data. When suspected outliers are present (unfilled circle in 129S4/SvJae sample) whiskers correspond to 1.5 IQR.
Figure 6
Figure 6
(A) Quantitative RT-PCR analysis of a selected group of genes implicated in meiotic chromosome regulation. Shown are relative expression levels using β-actin for normalization; (B) Western blot analysis of REC8 expression levels in testes of three pure mouse strains. The blot was probed with antibodies to REC8 and α-Tubulin. Graph shows results of quantification of REC8 levels normalized to α-Tubulin.

Similar articles

Cited by

References

    1. Costa Y., Cooke H.J. Dissecting the mammalian synaptonemal complex using targeted mutations. Chromosome Res. 2007;15:579–589. - PubMed
    1. Moses M.J. Structure and function of the synaptonemal complex. Genetics. 1969;61:41–51. - PubMed
    1. Moses M.J., Dresser M.E., Poorman P.A. Composition and role of the synaptonemal complex. Symp. Soc. Exp. Biol. 1984;38:245–270. - PubMed
    1. Page S.L., Hawley R.S. The genetics and molecular biology of the synaptonemal complex. Annu. Rev. Cell Dev. Biol. 2004;20:525–558. doi: 10.1146/annurev.cellbio.19.111301.155141. - DOI - PubMed
    1. Zickler D., Kleckner N. Meiotic chromosomes: integrating structure and function. Annu. Rev. Genet. 1999;33:603–754. doi: 10.1146/annurev.genet.33.1.603. - DOI - PubMed

LinkOut - more resources