. 2011 Aug 2;2(3):516-61.
doi: 10.3390/genes2030516.

Reassessing domain architecture evolution of metazoan proteins: major impact of errors caused by confusing paralogs and epaktologs

Affiliations

Reassessing domain architecture evolution of metazoan proteins: major impact of errors caused by confusing paralogs and epaktologs

Alinda Nagy et al. Genes (Basel). .

Abstract

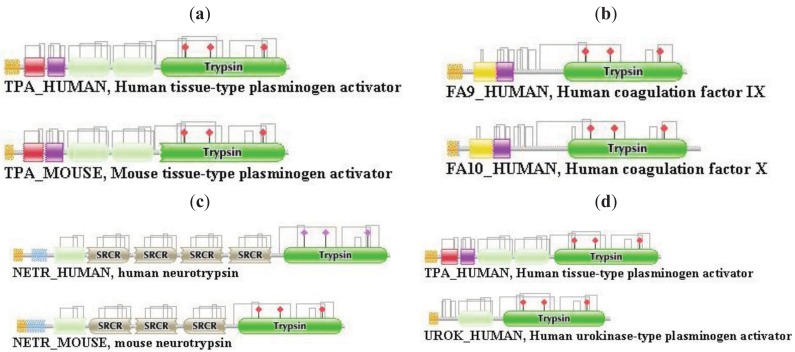
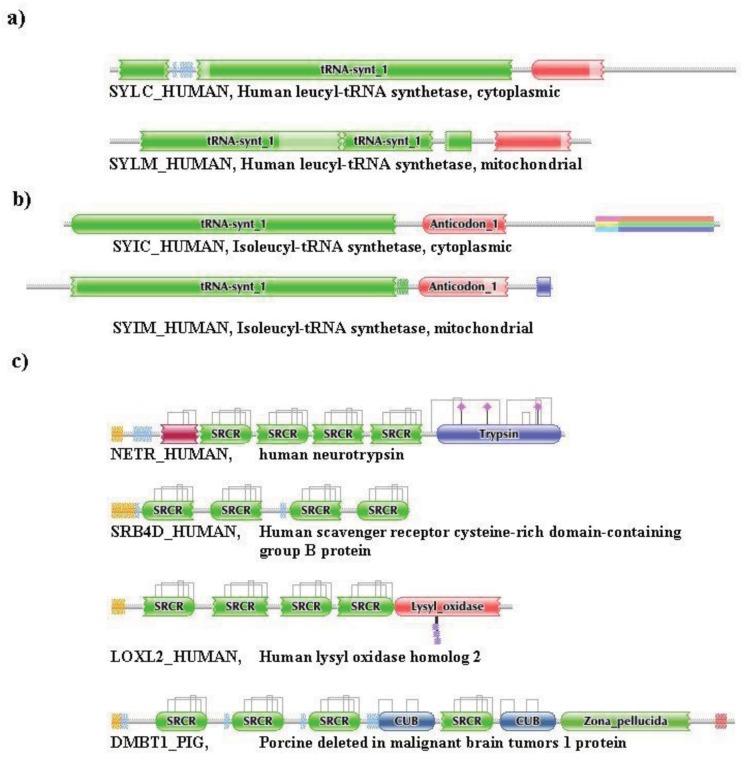
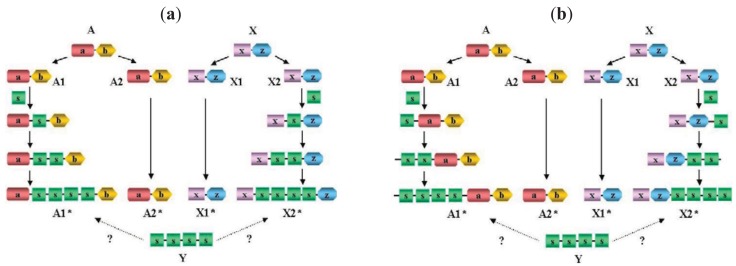
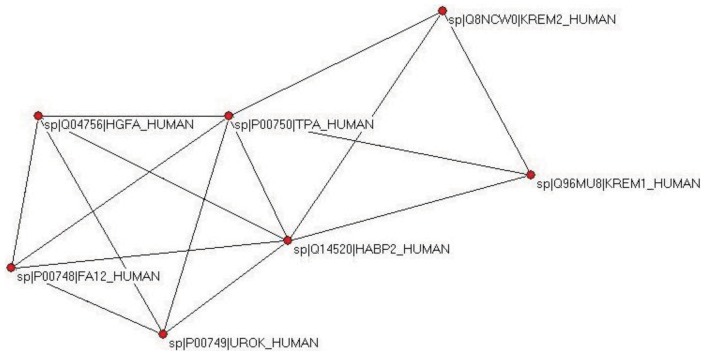
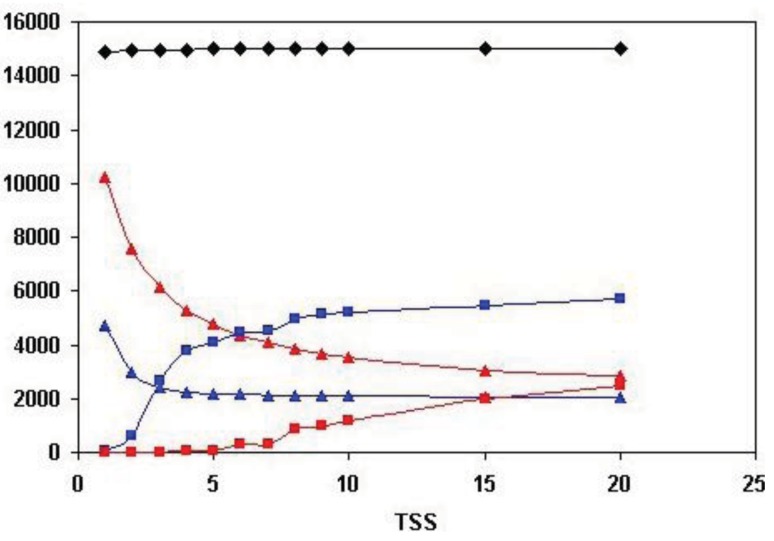
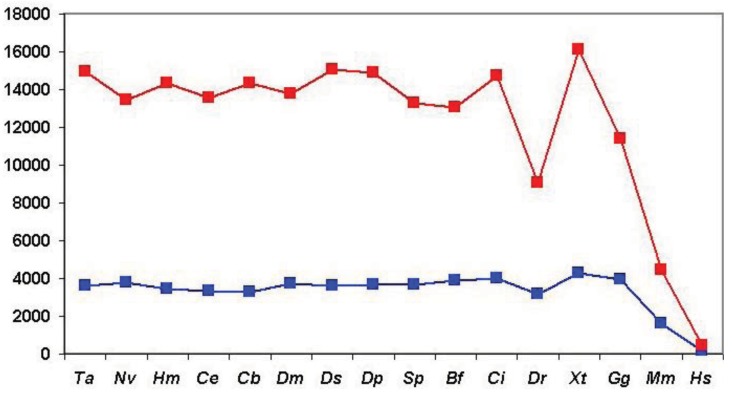
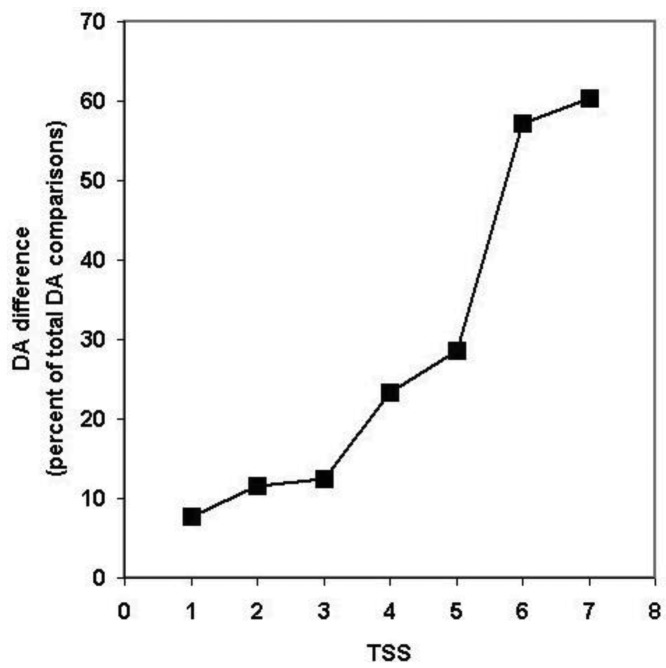
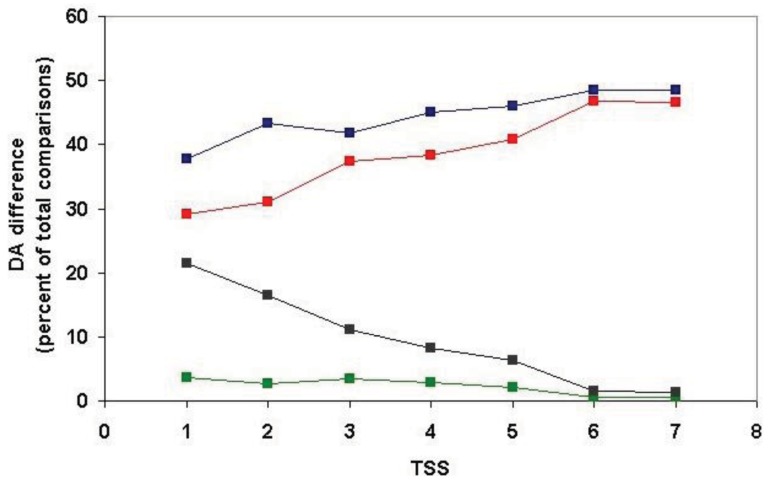
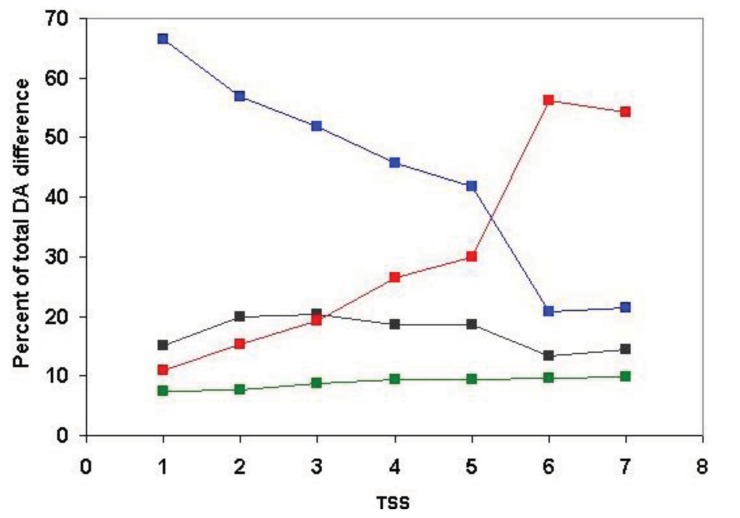
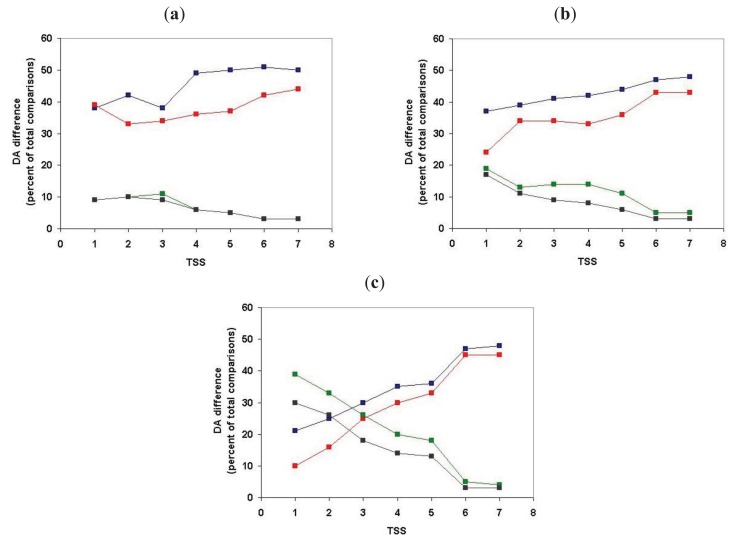
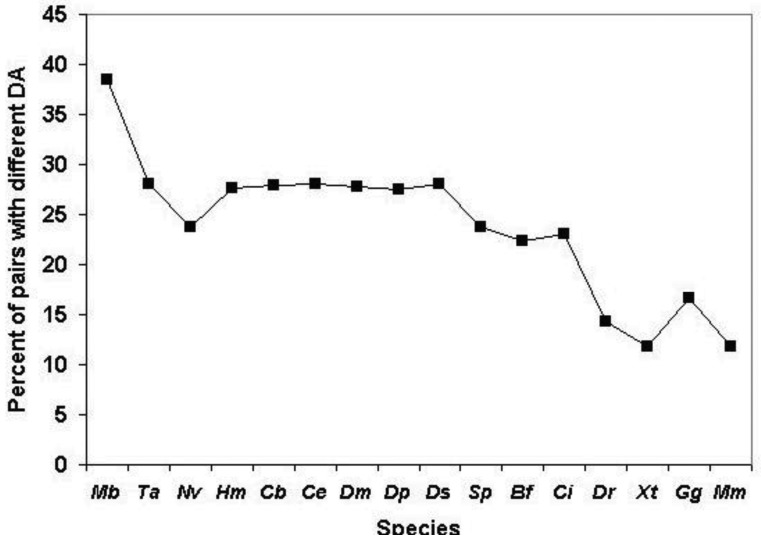
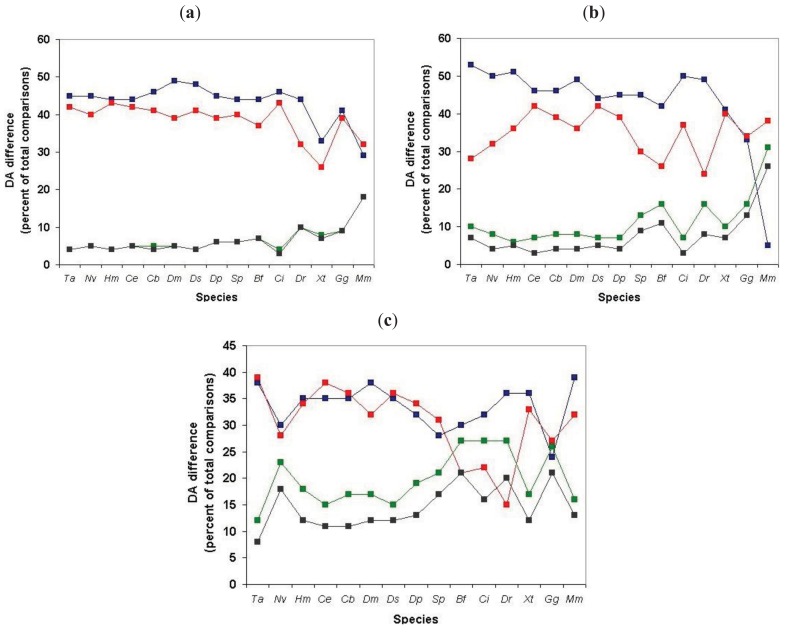
In the accompanying paper (Nagy, Szláma, Szarka, Trexler, Bányai, Patthy, Reassessing Domain Architecture Evolution of Metazoan Proteins: Major Impact of Gene Prediction Errors) we showed that in the case of UniProtKB/TrEMBL, RefSeq, EnsEMBL and NCBI's GNOMON predicted protein sequences of Metazoan species the contribution of erroneous (incomplete, abnormal, mispredicted) sequences to domain architecture (DA) differences of orthologous proteins might be greater than those of true gene rearrangements. Based on these findings, we suggest that earlier genome-scale studies based on comparison of predicted (frequently mispredicted) protein sequences may have led to some erroneous conclusions about the evolution of novel domain architectures of multidomain proteins. In this manuscript we examine the impact of confusing paralogous and epaktologous multidomain proteins (i.e., those that are related only through the independent acquisition of the same domain types) on conclusions drawn about DA evolution of multidomain proteins in Metazoa. To estimate the contribution of this type of error we have used as reference UniProtKB/Swiss-Prot sequences from protein families with well-characterized evolutionary histories. We have used two types of paralogy-group construction procedures and monitored the impact of various parameters on the separation of true paralogs from epaktologs on correctly annotated Swiss-Prot entries of multidomain proteins. Our studies have shown that, although public protein family databases are contaminated with epaktologs, analysis of the structure of sequence similarity networks of multidomain proteins provides an efficient means for the separation of epaktologs and paralogs. We have also demonstrated that contamination of protein families with epaktologs increases the apparent rate of DA change and introduces a bias in DA differences in as much as it increases the proportion of terminal over internal DA differences.We have shown that confusing paralogous and epaktologous multidomain proteins significantly increases the apparent rate of DA change in Metazoa and introduces a positional bias in favor of terminal over internal DA changes. Our findings caution that earlier studies based on analysis of datasets of protein families that were contaminated with epaktologs may have led to some erroneous conclusions about the evolution of novel domain architectures of multidomain proteins. A reassessment of the DA evolution of multidomain proteins is presented in an accompanying paper [1].


Figures

Figure 1
Figure 1
Types of homology of multidomain proteins: orthologs and paralogs. (a) Orthologous multidomain proteins with identical DA—human and mouse tissue plasminogen activator; (b) Paralogous multidomain proteins with identical DA—human factor 9 and human factor 10; (c) Orthologous multidomain proteins with different DA—human and mouse neurotrypsin; and (d) Paralogous multidomain proteins with different DA—human tPA and human urokinase.
Figure 2
Figure 2
Types of homology of multidomain proteins: pseudoparalogs and epaktologs. (a) Pseudoparalogous multidomain proteins with identical DA—cytoplasmic and mitochondrial Leucyl-tRNA synthetase; (b) Pseudoparalogous multidomain proteins with different DA—cytoplasmic Leucyl-tRNA synthetase and mitochondrial Isoleucyl-tRNA synthetase; and (c) Epaktologous proteins sharing homologous domains—human neurotrypsin, human scavenger receptor cysteine-rich domain-containing group B protein, human lysyl oxidase homolog 2 and porcine deleted in malignant brain tumors 1 protein.
Figure 3
Figure 3
Domain Architecture evolution: consequences of confusing epaktology and paralogy. Proteins A and X are unrelated ancestral multidomain proteins. During evolution domain shuffling inserts the same domain-type (domain s) into orthologs of A and X proteins independently followed by tandem duplication of this domain, resulting in proteins A1* and X2* in an extant species (Species*). Overall sequence similarity score of proteins A1* and X2* may be so significant that A1* appears to be much more closely related to X2* than its true paralog (A2*), therefore, based on sequence similarity searches it may be concluded that X2* is the closest paralog of A1* (inferring. that A1* and X2* diverged from a common hypothetical ancestor Y) and that independent terminal gain of domains a,b and x,z occurred in the two lines leading to paralogs A1* and X2*. In contrast with this interpretation, A1* is a paralog of A2* (and X1* is a paralog of X2*) and independent gain and duplication of an s domain occurred in both lineages. Note the that although the two scenarios depicted in (a) and (b) differ in the actual events (internal vs. terminal insertion of domain s), if the epaktologs are treated as paralogs the conclusion will be similar in as much as the DA of A1* and X2* differ in terminal positions.
Figure 4
Figure 4
Cluster containing TPA_HUMAN defined by analysis of the sequence similarity network for TSS = 3. Note that strong component analysis identifies a cluster that contains only paralogs (TPA_HUMAN, UROK_HUMAN, FA12_HUMAN, HGFA_HUMAN, HABP2_HUMAN), whereas the cluster defined by weak component analysis also contains two epaktologs: KREM1_HUMAN and KREM2_HUMAN).
Figure 5
Figure 5
Analysis of sequence similarity networks of paralogous human proteins defined through all-against-all sequence comparison of human Swiss-Prot entries. The matches were ranked in the order of decreasing sequence similarity scores, including in this list only the top-scoring 1, 2, 3, …. 20 matches with e-values of <10−5, excluding self-matches. Datasets containing the top-scoring one, two… twenty sequences were created (TSS = 1, TSS = 2, …. TSS = 20 datasets) and the component structure of sequence similarity networks defined for these datasets was analyzed as described in the text. The numbers on the abscissa indicate the number of top-scoring matches included in the analyses (TSS = 1, …. TSS = 20). Black diamonds represent the number of human Swiss-Prot entries with at least one significant human Swiss-Prot homolog. Blue triangles represent the number of weak components, red triangles represent the number of strong components. Blue rectangles represent the number of sequences in the Largest Connected Component of weak component analysis, red rectangles represent the number of sequences in the Largest Connected Component of strong component analysis.
Figure 6
Figure 6
Analysis of sequence similarity networks of paralogous human proteins defined through comparison of human Swiss-Prot entries with proteomes of Metazoanspecies. Clusters of homologous human Swiss-Prot entries were defined as sequences that gave the best match with the same entry in the given proteome using a cut-off value of e < 10−5. The species are listed in the order of decreasing evolutionary distance from Homo sapiens, thus the abscissa has a time-dimension but their distance is not drawn to scale. Blue rectangles represent the number of components (homologous clusters), red rectangles represent the number of human Swiss-Prot entries that are clustered by sequences of the target genome, i.e., that have at least one human paralog. Abbreviations on the abscissa: Ta - Trichoplax adhaerens, Nv - Nematostella vectensis, Hm - Hydra magnipapillata, Ce -Caenorhabditis elegans, Cb -Caenorhabditis briggsae, Dm -Drosophila melanogaster, Dp -Drosophila pseudoobscura, Ds - Drosophila simulans, Sp - Strongylocentrotus purpuratus, Bf - Branchiostoma floridae, Ci - Ciona intestinalis, Dr - Danio rerio, Xt - Xenopus tropicalis, Gg - Gallus gallus, Mm - Mus musculus, Hs -Homo sapiens.
Figure 7
Figure 7
Analysis of the DA of clusters defined by strong component analysis of sequence similarity networks of human Swiss-Prot sequences. The numbers on the abscissa indicate the number of top-scoring matches included in the analyses (TSS = 1, …. TSS = 7) used to define paralogous clusters. The values of the ordinate show the percent of DA comparisons within clusters where the pairs compared differ in DA. (Since the number of pair-wise comparisons and computational time increased exponentially with the increase of TSS values, the figure shows only data for TSS = 1−TSS = 7).
Figure 8
Figure 8
Analysis of the positional distribution of DA differences in clusters defined by strong component analysis of sequence similarity networks of human Swiss-Prot sequences. The numbers on the abscissa indicate the number of top-scoring matches included in the analyses (TSS = 1, …. TSS = 7) used to define paralogous clusters. N-terminal differences (blue rectangles), C-terminal differences (red rectangles), internal differences (green rectangles), tandem duplications (black rectangles).
Figure 9
Figure 9
Analysis of the relative frequency of homologous pairs of human Swiss-Prot sequences that differ in the number of domains by 1, 2, 3, … N domains in clusters defined by strong component analysis of sequence similarity networks of human Swiss-Prot sequences. Note that, in the case of close paralogs (TSS = 1, TSS = 2), the majority of pairs differ in a single domain (blue rectangle) and a small proportion of homologs differs in 2 (black rectangle), 3 (green rectangle) or ≥4 domains (red rectangle). Inclusion of more distant paralogs had little influence on the proportion of pairs that differ in 2 or 3 domains, however, a sharp increase in the proportion of DA changes involving ≥4 domains is observed when more than 5 top-scoring matches are included in the analysis. The numbers on the abscissa indicate the number of top-scoring matches included in the analyses used to define paralogous clusters.
Figure 10
Figure 10
Analysis of the positional distribution of DA differences of paralogous human Swiss-Prot sequences differing in single domains. The numbers on the abscissa indicate the number of top-scoring matches included in the analyses (TSS = 1, …. TSS = 7) used to define paralogous clusters. N-terminal differences (blue recrangles), C-terminal differences (red rectangles), internal differences (green rectangles), tandem duplications (black rectangles). (a) Positional distribution of DA differences for type 1 transitions; (b) Positional distribution of DA differences for type 2 transitions (note that, in the case of the closest paralogs (TSS = 1), the proportion of terminal and internal DA differences are comparable); and (c) Positional distribution of DA differences for type 3 transitions. Note that in the case of closest paralogs (TSS = 1 and TSS = 2) the proportion of internal DA difference exceeds those of N-terminal or C-terminal changes.
Figure 11
Figure 11
Analysis of the DA of paralogous clusters of human Swiss-Prot proteins defined through comparison with RefSeq proteomes of various species. The ordinate shows the proportion of pair-wise comparisons within clusters where the pairs differ in DA. On the abscissa the species are listed in the order of decreasing evolutionary distance from Homo sapiens, thus the abscissa has a time-dimension but their distance is not drawn to scale. Note that there is a significant drop in the proportion of pairs that differ in DA at the boundary of the invertebrate/vertebrate transition. Abbreviations on the abscissa: Ta - Trichoplax adhaerens, Nv - Nematostella vectensis, Hm - Hydra magnipapillata, Ce -Caenorhabditis elegans, Cb -Caenorhabditis briggsae, Dm -Drosophila melanogaster, Dp -Drosophila pseudoobscura, Ds - Drosophila simulans, Sp - Strongylocentrotus purpuratus, Bf - Branchiostoma floridae, Ci - Ciona intestinalis, Dr - Danio rerio, Xt - Xenopus tropicalis, Gg - Gallus gallus, Mm - Mus musculus.
Figure 12
Figure 12
Analysis of the positional distribution of DA differences in clusters of human Swiss-Prot proteins defined through comparison with RefSeq proteomes of various species. The ordinate shows the proportion of pair-wise comparisons within clusters where the pairs differ in DA. N-terminal differences (blue rectangles), C-terminal differences (red rectangles), internal differences (green rectangles), tandem duplications (black rectangles). (a) Positional distribution of DA differences for type 1 transitions; (b) Positional distribution of DA differences for type 2 transitions; and (c) Positional distribution of DA differences for type 3 transitions. Note that in the case of type 3 transitions the proportion of internal DA difference is comparable to those of N-terminal or C-terminal changes only in the case of chordate species. On the abscissa the species are listed in the order of decreasing evolutionary distance from Homo sapiens, thus the abscissa has a time-dimension but their distance is not drawn to scale. Abbreviations on the abscissa: Ta - Trichoplax adhaerens, Nv - Nematostella vectensis, Hm - Hydra magnipapillata, Ce -Caenorhabditis elegans, Cb -Caenorhabditis briggsae, Dm -Drosophila melanogaster, Dp -Drosophila pseudoobscura, Ds - Drosophila simulans, Sp - Strongylocentrotus purpuratus, Bf - Branchiostoma floridae, Ci - Ciona intestinalis, Dr - Danio rerio, Xt - Xenopus tropicalis, Gg - Gallus gallus, Mm - Mus musculus.

Similar articles

Cited by

References

    1. Nagy A., Patthy L. Reassessing Domain Architecture Evolution of Metazoan Proteins: Contribution of Different Evolutionary Mechanisms. Genes. 2011 submitted for publication. - PMC - PubMed
    1. Patthy L. Modular assembly of genes and the evolution of new functions. Genetica. 2003;118:217–231. - PubMed
    1. Tordai H., Nagy A., Farkas K., Banyai L., Patthy L. Modules, multidomain proteins and organismic complexity. FEBS J. 2005;272:5064–5078. - PubMed
    1. Nagy A., Szláma G., Szarka E., Trexler M., Bányai L., Patthy L. Reassessing Domain Architecture Evolution of Metazoan Proteins: Major Impact of Gene Prediction Errors. Genes. 2011;2:449–501. - PMC - PubMed
    1. Fitch W.M. Homology: A personal view on some of the problems. Trends Genet. 2000;16:227–231. - PubMed

LinkOut - more resources