

Increasing the Content of High-Content Screening: An Overview
- PMID: 24710339
- PMCID: PMC4230961
- DOI: 10.1177/1087057114528537
Increasing the Content of High-Content Screening: An Overview
Abstract
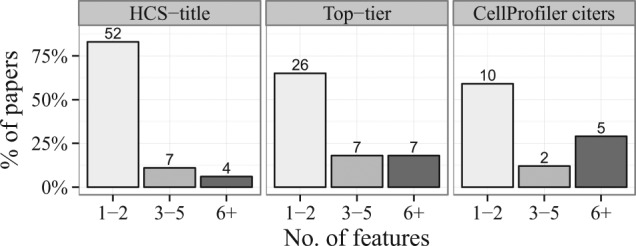
Target-based high-throughput screening (HTS) has recently been critiqued for its relatively poor yield compared to phenotypic screening approaches. One type of phenotypic screening, image-based high-content screening (HCS), has been seen as particularly promising. In this article, we assess whether HCS is as high content as it can be. We analyze HCS publications and find that although the number of HCS experiments published each year continues to grow steadily, the information content lags behind. We find that a majority of high-content screens published so far (60-80%) made use of only one or two image-based features measured from each sample and disregarded the distribution of those features among each cell population. We discuss several potential explanations, focusing on the hypothesis that data analysis traditions are to blame. This includes practical problems related to managing large and multidimensional HCS data sets as well as the adoption of assay quality statistics from HTS to HCS. Both may have led to the simplification or systematic rejection of assays carrying complex and valuable phenotypic information. We predict that advanced data analysis methods that enable full multiparametric data to be harvested for entire cell populations will enable HCS to finally reach its potential.
Keywords: Cell-based assays; high-content screening; image analysis; phenotypic drug discovery; statistical analyses.
© 2014 Society for Laboratory Automation and Screening.
Conflict of interest statement
Figures


References
-
- Swinney D. C., Anthony J. How Were New Medicines Discovered? Nat. Rev. Drug Discov. 2011, 10, 507–519. - PubMed
-
- Perlman Z. E., Slack M. D., Feng Y., et al. Multidimensional Drug Profiling by Automated Microscopy. Science 2004, 306, 1194–1198. - PubMed
-
- Loo L.-H., Wu L. F., Altschuler S. J. Image-Based Multivariate Profiling of Drug Responses from Single Cells. Nat. Methods 2007, 4, 445–453. - PubMed
-
- Genovesio A., Kwon Y.-J., Windisch M. P., et al. Automated Genome-Wide Visual Profiling of Cellular Proteins Involved in HIV Infection. J. Biomol. Screen. 2011, 16, 945–958. - PubMed
-
- Zhang J.-H. A Simple Statistical Parameter for Use in Evaluation and Validation of High Throughput Screening Assays. J. Biomol. Screen. 1999, 4, 67–73. - PubMed
Publication types
MeSH terms
LinkOut - more resources
Full Text Sources
Other Literature Sources
Research Materials
