. 2014 Apr 7;9(4):e94286.
doi: 10.1371/journal.pone.0094286. eCollection 2014.

Combined fishing and climate forcing in the southern Benguela upwelling ecosystem: an end-to-end modelling approach reveals dampened effects

Affiliations

Combined fishing and climate forcing in the southern Benguela upwelling ecosystem: an end-to-end modelling approach reveals dampened effects

Morgane Travers-Trolet et al. PLoS One. .

Abstract

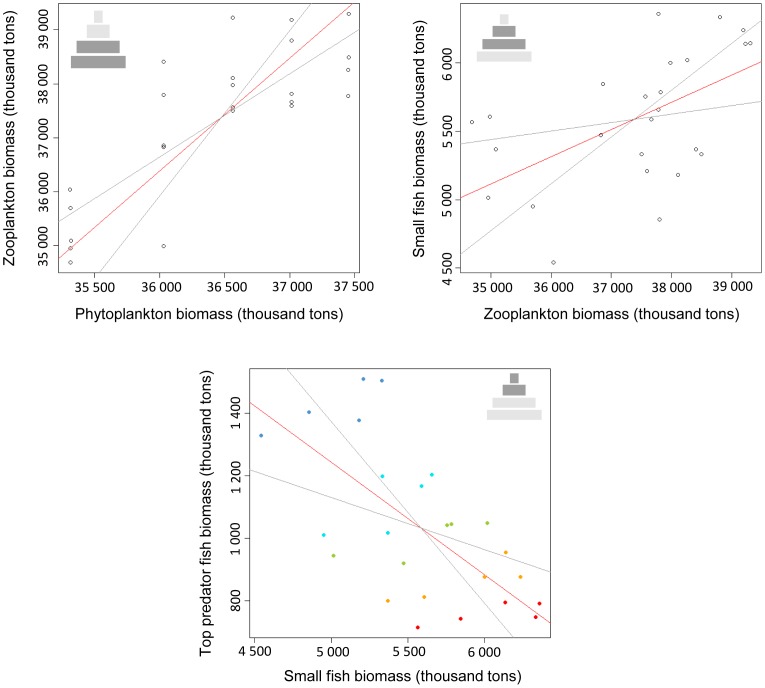
The effects of climate and fishing on marine ecosystems have usually been studied separately, but their interactions make ecosystem dynamics difficult to understand and predict. Of particular interest to management, the potential synergism or antagonism between fishing pressure and climate forcing is analysed in this paper, using an end-to-end ecosystem model of the southern Benguela ecosystem, built from coupling hydrodynamic, biogeochemical and multispecies fish models (ROMS-N2P2Z2D2-OSMOSE). Scenarios of different intensities of upwelling-favourable wind stress combined with scenarios of fishing top-predator fish were tested. Analyses of isolated drivers show that the bottom-up effect of the climate forcing propagates up the food chain whereas the top-down effect of fishing cascades down to zooplankton in unfavourable environmental conditions but dampens before it reaches phytoplankton. When considering both climate and fishing drivers together, it appears that top-down control dominates the link between top-predator fish and forage fish, whereas interactions between the lower trophic levels are dominated by bottom-up control. The forage fish functional group appears to be a central component of this ecosystem, being the meeting point of two opposite trophic controls. The set of combined scenarios shows that fishing pressure and upwelling-favourable wind stress have mostly dampened effects on fish populations, compared to predictions from the separate effects of the stressors. Dampened effects result in biomass accumulation at the top predator fish level but a depletion of biomass at the forage fish level. This should draw our attention to the evolution of this functional group, which appears as both structurally important in the trophic functioning of the ecosystem, and very sensitive to climate and fishing pressures. In particular, diagnoses considering fishing pressure only might be more optimistic than those that consider combined effects of fishing and environmental variability.


Conflict of interest statement

Competing Interests: The authors have declared that no competing interests exist.

Figures

Figure 1
Figure 1. Spatial characteristics of the coupled models.
(a) Annual primary production (in gC.m−2.d−1) in the upper 65 m simulated by ROMS-N2P2Z2D2 (adapted from [36]) and (b) spatial extent of fish individuals modeled in OSMOSE, aggregated over species, ages and seasons with delimitation of the 200 m and 500 m bathymetry.
Figure 2
Figure 2. Processes represented within and for coupling the model components.
Processes modelled within a time step (15 days) in OSMOSE (left hand side) and fluxes represented between functional groups in N2P2Z2D2 (right hand side). Coupling of models occurs through the predation process, where plankton biomass serves as a prey field for fish schools (arrow 1), and an explicit fish-induced predation mortality is applied as feedback on plankton groups (arrow 2).
Figure 3
Figure 3. Simulations plan and combination of climate and fishing forcing factors.
The blue cell (1;1) corresponds to the current situation of fishing and wind stress forcing. Orange cells correspond to one forcing factor varying and the other factor kept at its current level, i.e. separate effects of fishing (horizontal orange line) and of climate (vertical orange line). The circles represent the simulation of combined effects: the lower half circle represents the bottom-up wind stress forcing, and the upper half circle the top-down fishing pressure. For each half circle, white codes for a negative direct effect (decreased wind stress leads to lower primary production, increased fishing pressure leads to lower biomass of top predator fish), whereas black codes for a direct positive effect.
Figure 4
Figure 4. Change of biomass of the four main trophic groups for the 25 sets of simulations.
Biomasses are expressed relatively to the baseline situation. Fishing pressure on top predator fish and wind forcing vary according to a multiplier of the baseline values. Blue and red bars represent positive and negative responses, respectively.
Figure 5
Figure 5. Model II regressions between adjacent trophic levels.
Model II regressions are examined between phytoplankton and zooplankton biomass, between zooplankton and small fish biomass, and between small fish and top predator fish biomass. In red, the regression line estimated using major axis regression (MA), and in grey its confidence intervals. On the last graph, coloured dots show the increase of fishing pressure on top predator fish from 0 (dark blue dots) to heavily exploited (red dots). Schematic trophic pyramids are inset top of each plot - model groups regressed are indicated in darker shading.
Figure 6
Figure 6. Comparison of combined effects versus separate effects of fishing and climate for each trophic group.
Each panel shows relative change of biomass of a trophic group (A: phytoplankton, B: zooplankton, C: small fish, D: top predator fish) when fishing pressure and wind stress act simultaneously (combined effect, y-axis) versus relative change of biomass computed from scenarios of wind stress and fishing pressure acting separately (x-axis). The 1∶1 line represents combined effects equal to the sum of separate effects, i.e. neither synergism nor dampening of effects. The symbols used are the same as in figure 3, each circle corresponding to one of the combined scenarios simulated: the lower half circle represents the bottom-up wind stress forcing, and the upper half circle the top-down fishing pressure. White half-circles code for a negative direct effect (decreased wind stress leads to lower primary production, increased fishing pressure leads to lower biomass of top predator fish), whereas black half-circles represent a direct positive effect. In the yellow area of the plot, the combined effects are amplified compared to the addition of isolated effects; in the purple area, the combined effects are dampened, and in the white area, the combined effects are antagonistic to additional effects.

References

    1. Pachauri RK, Reisinger A (2007) Climate Change 2007: Synthesis Report. Contribution of Working Groups I, II and III to the Fourth Assessment Report of the Intergovernmental Panel on Climate Change. Intergovernmental Panel on Climate Change.
    1. Beaugrand G, Reid PC, Ibañez F, Lindley JA, Edwards M (2002) Reorganization of North Atlantic Marine Copepod Biodiversity and Climate. Science 296: 1692–1694. - PubMed
    1. Drinkwater KF (2005) The response of Atlantic cod (Gadus morhua) to future climate change. ICES Journal of Marine Science 62: 1327–1337.
    1. Durant JM, Hjermann DØ, Anker-Nilssen T, Beaugrand G, Mysterud A, et al. (2005) Timing and abundance as key mechanisms affecting trophic interactions in variable environments. Ecology Letters 8: 952–958. - PubMed
    1. Walther G-R, Post E, Convey P, Menzel A, Parmesan C, et al. (2002) Ecological responses to recent climate change. Nature 416: 389–395. - PubMed

Publication types

LinkOut - more resources