. 2012 Aug 24;1(3):576-96.
doi: 10.3390/cells1030576.

Neuroantigen-Specific CD4 Cells Expressing Interferon-γ (IFN-γ), Interleukin (IL)-2 and IL-3 in a Mutually Exclusive Manner Prevail in Experimental Allergic Encephalomyelitis (EAE)

Affiliations

Neuroantigen-Specific CD4 Cells Expressing Interferon-γ (IFN-γ), Interleukin (IL)-2 and IL-3 in a Mutually Exclusive Manner Prevail in Experimental Allergic Encephalomyelitis (EAE)

Alexey Y Karulin et al. Cells. .

Abstract

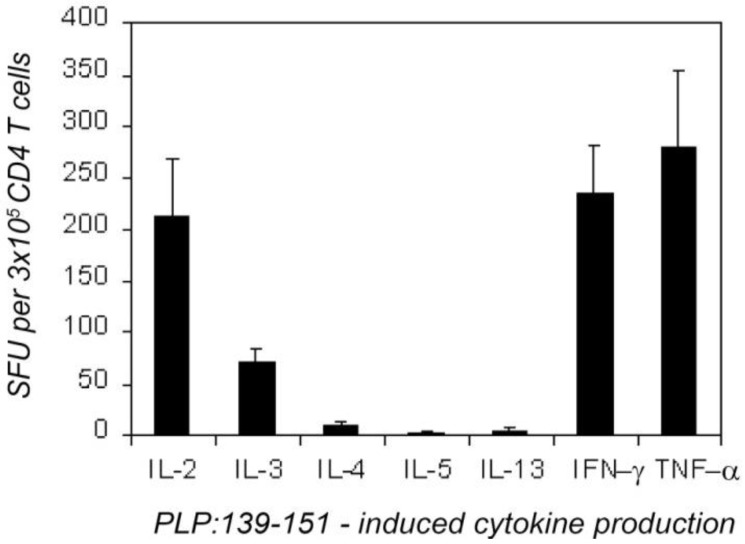
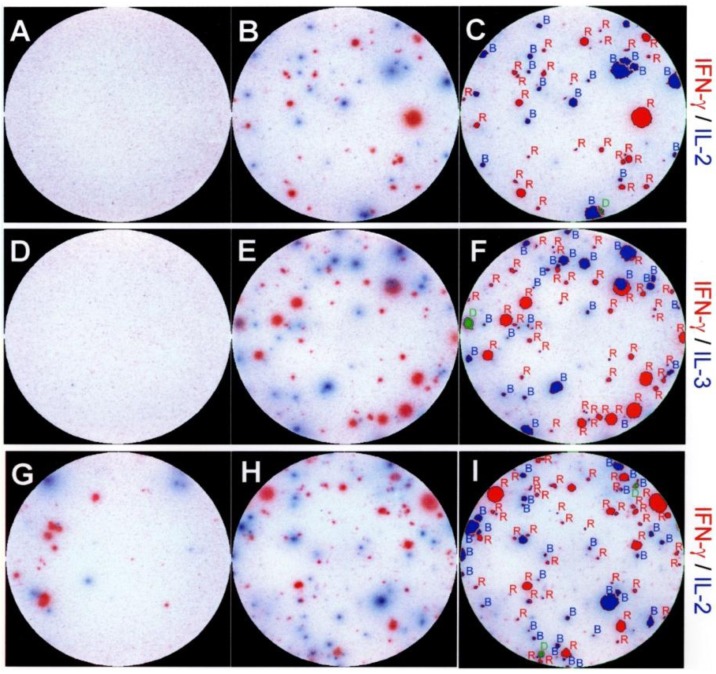
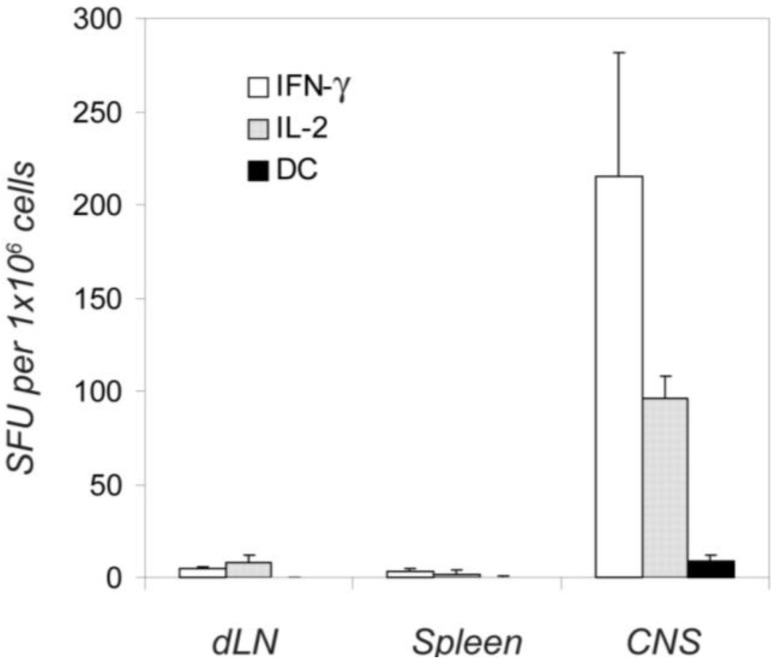
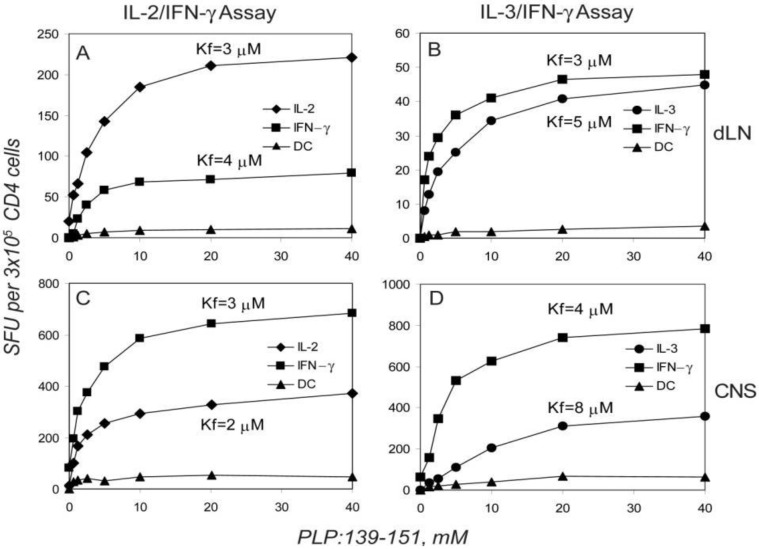
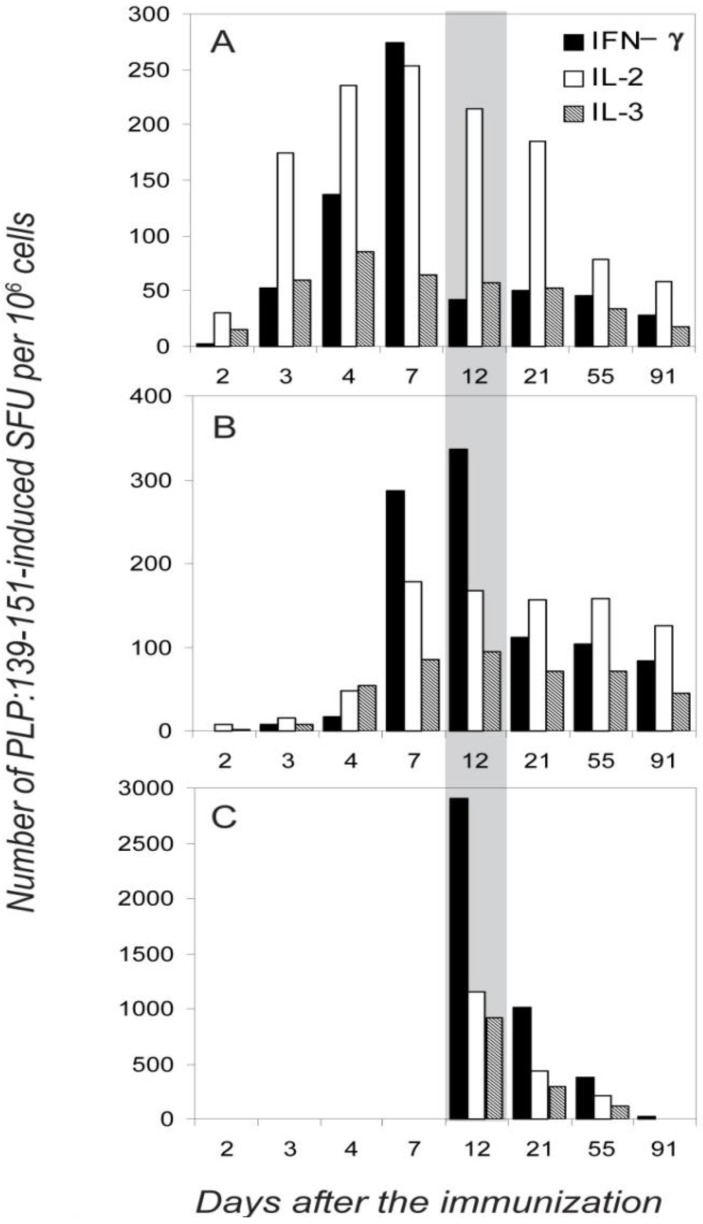
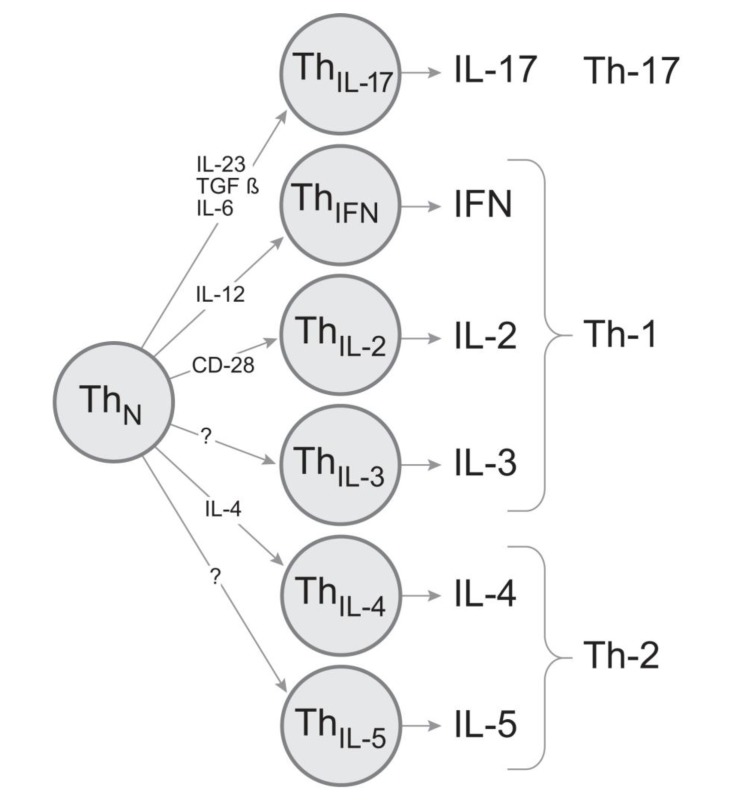
Experimental allergic encephalomyelitis (EAE) is mediated by neuroantigen-specific pro-inflammatory T cells of the Th1 and Th17 effector class. Th-17 cells can be clearly defined by expression of IL-17, but not IFN-γ, IL-2 or IL-3. Th1 cells do not express IL-17, but it is unclear presently to what extent they co-express the cytokines canonically assigned to Th1 immunity (i.e., IFN-γ, IL-2 and IL-3) and whether CD4 cells producing these cytokines indeed belong to a single Th1 lineage. It is also unclear to what extent the Th1 response in EAE entails polyfunctional T cells that co-express IFN-γ and IL-2. Therefore, we dissected the Th1 cytokine signature of neuroantigen-specific CD4 cells studying at single cell resolution co-expression of IFN-γ, IL-2 and IL-3 using dual color cytokine ELISPOT analysis. Shortly after immunization, in the draining lymph nodes (dLN), the overall cytokine signature of the neuroantigen-specific CD4 cells was highly type 1-polarized, but IFN-γ, IL-2, and IL-3 were each secreted by different CD4 cells in a mutually exclusive manner. This single cell - single cytokine profile was stable through the course of chronic EAE-polyfunctional CD4 cells co-expressing IL-2 and IFN-γ presented less than 5% of the neuroantigen-specific T cells, even in the inflamed CNS itself. The neuroantigen-specific CD4 cells that expressed IFN-γ, IL-2 and IL-3 in a mutually exclusive manner exhibited similar functional avidities and kinetics of cytokine production, but showed different tissue distributions. These data suggest that Th1 cells do not belong to a single lineage, but different Th1 subpopulations jointly mediate Th1 immunity.


Figures

Figure 1
Figure 1
Overall type-1 cytokine profile of proteolipid protein (PLP):139-151-specific CD4 cells 7 days after the immunization with PLP:139-151. CD4 cells (3 × 10⁵/well) purified from draining lymph nodes (dLN) were tested with naive syngeneic (SJL) LN cells (5 × 10⁵/well) in the presence of a maximally stimulatory dose of PLP:139-151 peptide (20 mM). Enzyme-linked immunospots (ELISPOTs) (SFU) were counted by an image analyzer. The results were obtained in four independent experiments, each with four–six mice tested individually. These data are expressed as the mean + SD spots forming cells per 3 × 10⁵ CD4 cells tested.
Figure 2
Figure 2
Representative images of double color ELISPOT wells showing dissociated production of interleukin (IL)-2, IL-3 and IFN-γ by individual PLP:139-151 specific CD4 cells. In panels (A-F) CD4 cells purified from dLN seven days after the immunization with PLP:139-151 peptide. In panels (G-I) freshly isolated spinal cord mononuclear cells were tested with naive splenic APC on day 21, during the second episode of paralytic EAE. The medium control wells are shown on the left (A,D,G), wells containing the PLP:139-151 peptide (at 20 mM) are shown in the middle (B,E,H). The cytokine pair measured is specified on the right whereby the color of the substrate and the name of the cytokine are matched. The wells shown have been selected from serial dilutions of T cells; for better visual representation, they were also chosen to have optimal cell density and comparable numbers of red and blue spots. The result of two color image analysis of the peptide-stimulated wells (B,E,H) is shown in the panels on the right (C,F,I) as an overlay of the analyzed image and the original image. Single positive (blue or red spots) are outlined and labeled in red or blue, double positive spots are marked in green. Two color image analysis was performed as described previously [6] and in Experimental Section 4.3.
Figure 3
Figure 3
Endogenously activated autoreactive T cells produce either IFN-γ or IL-2, but not both simultaneously (double color, DC). Twelve days after the immunization with the PLP peptide, 1 × 10⁶ unseparated dLN cells, spleen cells, and spinal cord mononuclear cells were plated per well and tested in an IFN-γ /IL-2 double color ELISPOT assay of 48 h duration. Single and double color spots were counted by image analysis. Means and SD of spot forming cells for four independent experiments are shown, with triplicate wells in each experiment.
Figure 4
Figure 4
Dissociated production of IL-2, IL-3, and IFN-γ by PLP:139-151-specific CD4 T cells is independent of the peptide dose used for T cell activation; the single cytokine producing CD4 cells have similar functional avidities. Twelve days after immunization, CD4 cells were isolated from dLN (A,B) and mononuclear cells were isolated from the spinal cord (C,D) of SJL mice during the first episode of paralytic encephalomyelitis (EAE). The numbers of single and double-cytokine-producing cells within the 3 × 10⁵ cells plated per well are plotted vs. the peptide concentrations used for stimulating the CD4 cells. Isolated CD4 cells were tested with 5 × 10⁵ APC (irradiated naive SJL spleen cells). The peptide concentration leading to the 50% from maximum activation (Kf) defining functional avidity is shown for each single-cytokine dose-response curve (for details see Experimental Procedures). Data shown represent mean values measured from triplicate wells in one of 4 representative experiments. The standard deviations for all data points were less than 5% (comparable in size to symbols used) and are not shown.
Figure 5
Figure 5
Different organ distribution of PLP:139-151-specific single-cytokine producing T cells during the course of EAE. The frequencies of PLP:139-151-induced IFN-γ, IL-2 and IL-3 spots are shown per one million of mononuclear cells in the dLN (A), spleen (B) and spinal cord (C) measured at different time points after the immunization: days 2, 3, 4 and 7 (before the onset of EAE,) at day 12 (during the first paralysis), and at days 21, 55, and 91 (during the first, second and third relapses of paralytic EAE). The data shown are for T cell activation with 20 mM PLP:139-151. Because the frequencies of double positive cells were consistently <7%, they are not included in the figure. In each experiment mean spot numbers were calculated from three–four replicate wells, SD between replicate wells for all data points did not exceed 10%. For each time point, mean values are shown for data obtained in three independent experiments, testing four mice individually in each experiment. SD between the experiments was <15%. Because statistical analysis included intra- and inter- experiment data and because experimental errors were much lower then differences between data points we aimed to highlight, error bars are not shown.
Figure 6
Figure 6
Proposed model for CD4 cell cytokine sublineages. The production of each key effector cytokine is delegated to a separate lineage. They arise through instructive differentiation driven by specific cytokine environments and/or signals. The individual cytokine lineages are clonally expandable permitting to deliver precise effector functions.

References

    1. Murphy K., Ouyang W., Farrar J., Yang J., Ranganath S., Asnagli H., Afkarian M., Murphy T. Signaling and transcription in T helper development. Annu. Rev. Immunol. 2000;18:451–494. doi: 10.1146/annurev.immunol.18.1.451. - DOI - PubMed
    1. Han Q., Bagheri N., Bradshaw E., Hafler D., Lauffenburger D., Love J. Polyfunctional responses by human T cells result from sequential release of cytokines. Proc. Natl. Acad. Sci. USA. 2012;109:1607–1612. - PMC - PubMed
    1. Kryczek I., Banerjee M., Cheng P., Vatan L., Szeliga W., Wei S., Huang E., Finlayson E., Simeone D., Welling T., et al. Phenotype, distribution, generation, and functional and clinical relevance of Th17 cells in the human tumor environments. Blood. 2009;114:1141–1149. - PMC - PubMed
    1. Bucy R., Karr L., Huang G., Li J., Carter D., Honjo K., Lemons J., Murphy K., Weaver C. Single cell analysis of cytokine gene coexpression during CD4+ T-cell phenotype development. Proc. Natl. Acad. Sci. USA. 1995;92:7565–7569. - PMC - PubMed
    1. Saparov A., Elson C., Devore-Carter D., Bucy R., Weaver C. Single-cell analyses of CD4+ T cells from alpha beta T cell receptor- transgenic mice: A distinct mucosal cytokine phenotype in the absence of transgene-specific antigen. Eur. J. Immunol. 1997;27:1774–1781. doi: 10.1002/eji.1830270727. - DOI - PubMed