Quantifying position-dependent codon usage bias
- PMID: 24710515
- PMCID: PMC4069614
- DOI: 10.1093/molbev/msu126
Quantifying position-dependent codon usage bias
Abstract
Although the mapping of codon to amino acid is conserved across nearly all species, the frequency at which synonymous codons are used varies both between organisms and between genes from the same organism. This variation affects diverse cellular processes including protein expression, regulation, and folding. Here, we mathematically model an additional layer of complexity and show that individual codon usage biases follow a position-dependent exponential decay model with unique parameter fits for each codon. We use this methodology to perform an in-depth analysis on codon usage bias in the model organism Escherichia coli. Our methodology shows that lowly and highly expressed genes are more similar in their codon usage patterns in the 5'-gene regions, but that these preferences diverge at distal sites resulting in greater positional dependency (pD, which we mathematically define later) for highly expressed genes. We show that position-dependent codon usage bias is partially explained by the structural requirements of mRNAs that results in increased usage of A/T rich codons shortly after the gene start. However, we also show that the pD of 4- and 6-fold degenerate codons is partially related to the gene copy number of cognate-tRNAs supporting existing hypotheses that posit benefits to a region of slow translation in the beginning of coding sequences. Lastly, we demonstrate that viewing codon usage bias through a position-dependent framework has practical utility by improving accuracy of gene expression prediction when incorporating positional dependencies into the Codon Adaptation Index model.
Keywords: coding sequence evolution; codon adaptation; codon usage bias; gene expression.
© The Author 2014. Published by Oxford University Press on behalf of the Society for Molecular Biology and Evolution.
Figures

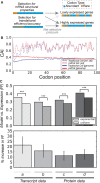
 ). Results for each bin are depicted according to the quadratically scaled color bar, and the ten bins are arranged from 5′ to 3′.


 for all cases illustrated). (B) We calculated the effect on folding energy of single synonymous codon substitutions in the genes of high abundance proteins. Left: The effect of substitutions in the 5′ region (−36 to +36 nt, relative to the start codon) is variable depending on the nature of the codon. Right: The same analysis for a region distal to the start codon (+36 to 108 nt). For all cases illustrated, error bars represent standard error of the mean and
  according to Wilcoxon rank-sum test.

 for all cases).
Similar articles
-
The Codon Usage of Lowly Expressed Genes Is Subject to Natural Selection.Genome Biol Evol. 2018 Apr 1;10(5):1237-1246. doi: 10.1093/gbe/evy084. Genome Biol Evol. 2018. PMID: 29688501 Free PMC article.
-
Codon Bias Patterns of E. coli's Interacting Proteins.PLoS One. 2015 Nov 13;10(11):e0142127. doi: 10.1371/journal.pone.0142127. eCollection 2015. PLoS One. 2015. PMID: 26566157 Free PMC article.
-
Codon usage in highly expressed genes of Haemophillus influenzae and Mycobacterium tuberculosis: translational selection versus mutational bias.Gene. 1998 Jul 30;215(2):405-13. doi: 10.1016/s0378-1119(98)00257-1. Gene. 1998. PMID: 9714839
-
The Yin and Yang of codon usage.Hum Mol Genet. 2016 Oct 1;25(R2):R77-R85. doi: 10.1093/hmg/ddw207. Epub 2016 Jun 27. Hum Mol Genet. 2016. PMID: 27354349 Free PMC article. Review.
-
Determinants of DNA sequence divergence between Escherichia coli and Salmonella typhimurium: codon usage, map position, and concerted evolution.J Mol Evol. 1991 Jul;33(1):23-33. doi: 10.1007/BF02100192. J Mol Evol. 1991. PMID: 1909371 Review.
Cited by
-
Codon usage pattern and predicted gene expression in Arabidopsis thaliana.Gene X. 2019 Mar 6;2:100012. doi: 10.1016/j.gene.2019.100012. eCollection 2019 Jun. Gene X. 2019. PMID: 32550546 Free PMC article.
-
Using the Mutation-Selection Framework to Characterize Selection on Protein Sequences.Genes (Basel). 2018 Aug 13;9(8):409. doi: 10.3390/genes9080409. Genes (Basel). 2018. PMID: 30104502 Free PMC article. Review.
-
Intragenomic variation in non-adaptive nucleotide biases causes underestimation of selection on synonymous codon usage.PLoS Genet. 2022 Jun 17;18(6):e1010256. doi: 10.1371/journal.pgen.1010256. eCollection 2022 Jun. PLoS Genet. 2022. PMID: 35714134 Free PMC article.
-
A novel framework for evaluating the performance of codon usage bias metrics.J R Soc Interface. 2018 Jan;15(138):20170667. doi: 10.1098/rsif.2017.0667. J R Soc Interface. 2018. PMID: 29386398 Free PMC article.
-
Leveraging genome-wide datasets to quantify the functional role of the anti-Shine-Dalgarno sequence in regulating translation efficiency.Open Biol. 2017 Jan;7(1):160239. doi: 10.1098/rsob.160239. Open Biol. 2017. PMID: 28100663 Free PMC article.
References
-
- Akaike H. A new look at the statistical model identification. IEEE Trans Automat Contr. 1974;19:716–723.
-
- Bulmer M. Codon usage and intragenic position. J Theor Biol. 1988;133:67–71. - PubMed
-
- Burnham KP. Multimodel inference: understanding AIC and BIC in model selection. Sociol Methods Res. 2004;33:261–304.
Publication types
MeSH terms
Substances
Grants and funding
LinkOut - more resources
Full Text Sources
Other Literature Sources

