. 2014 Apr 14;205(1):83-96.
doi: 10.1083/jcb.201311104. Epub 2014 Apr 7.

A contractile and counterbalancing adhesion system controls the 3D shape of crawling cells

Affiliations

A contractile and counterbalancing adhesion system controls the 3D shape of crawling cells

Dylan T Burnette et al. J Cell Biol. .

Abstract

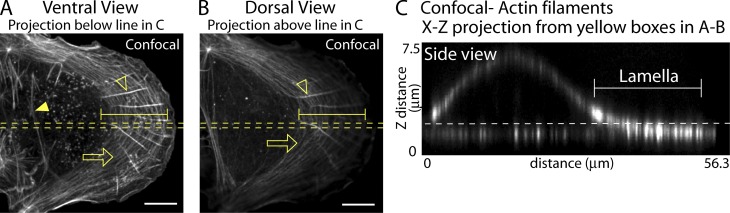
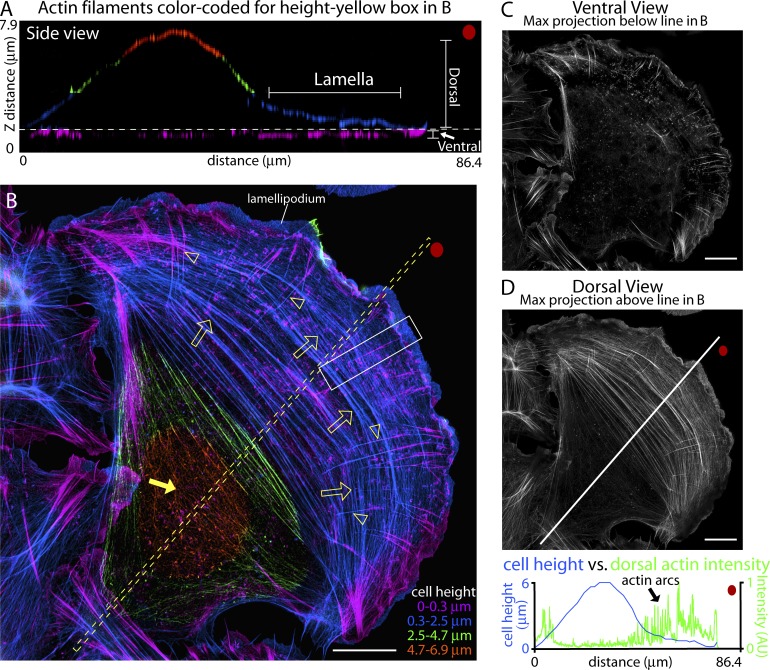
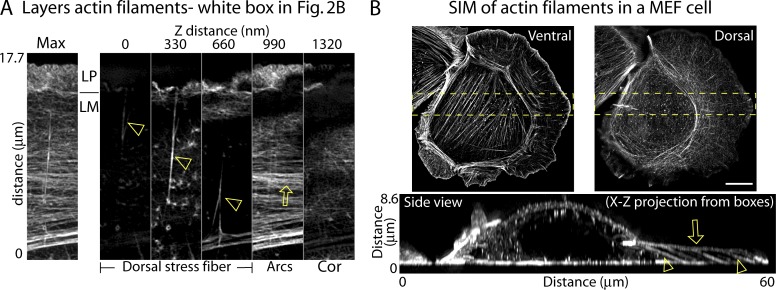
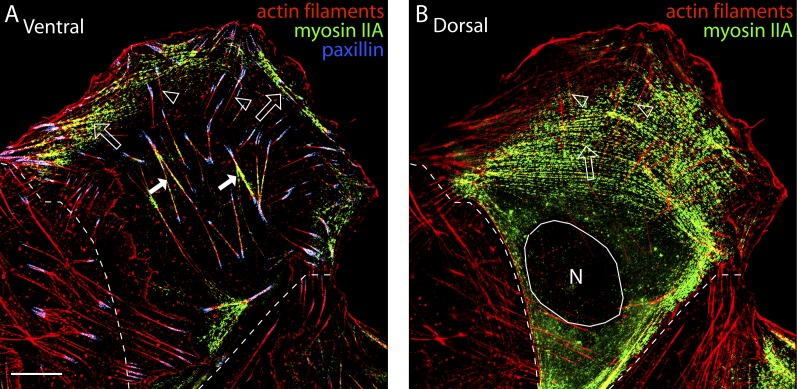
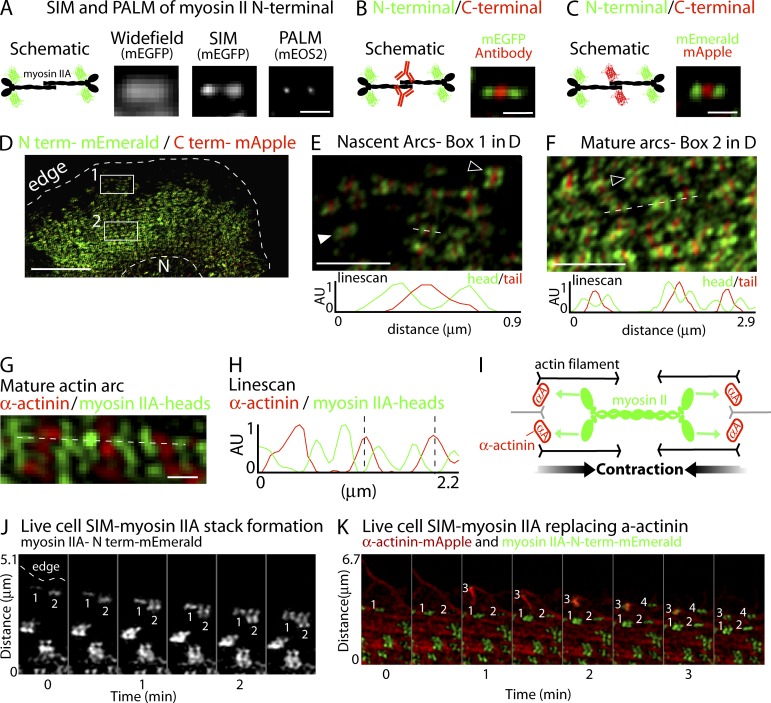
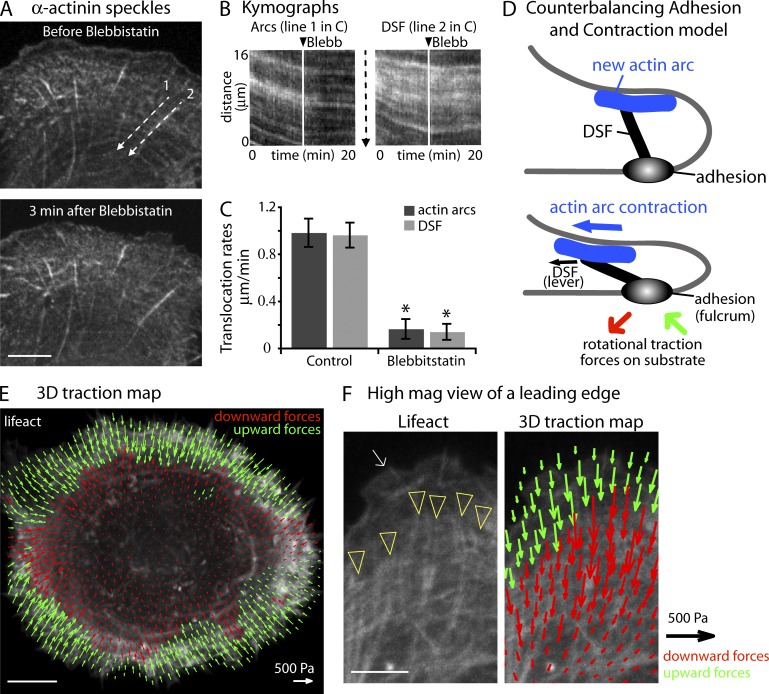
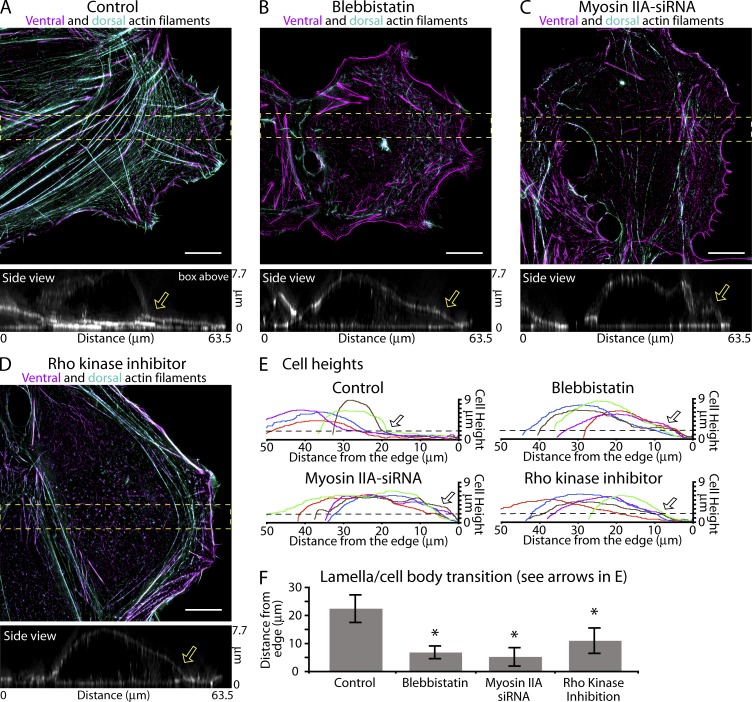
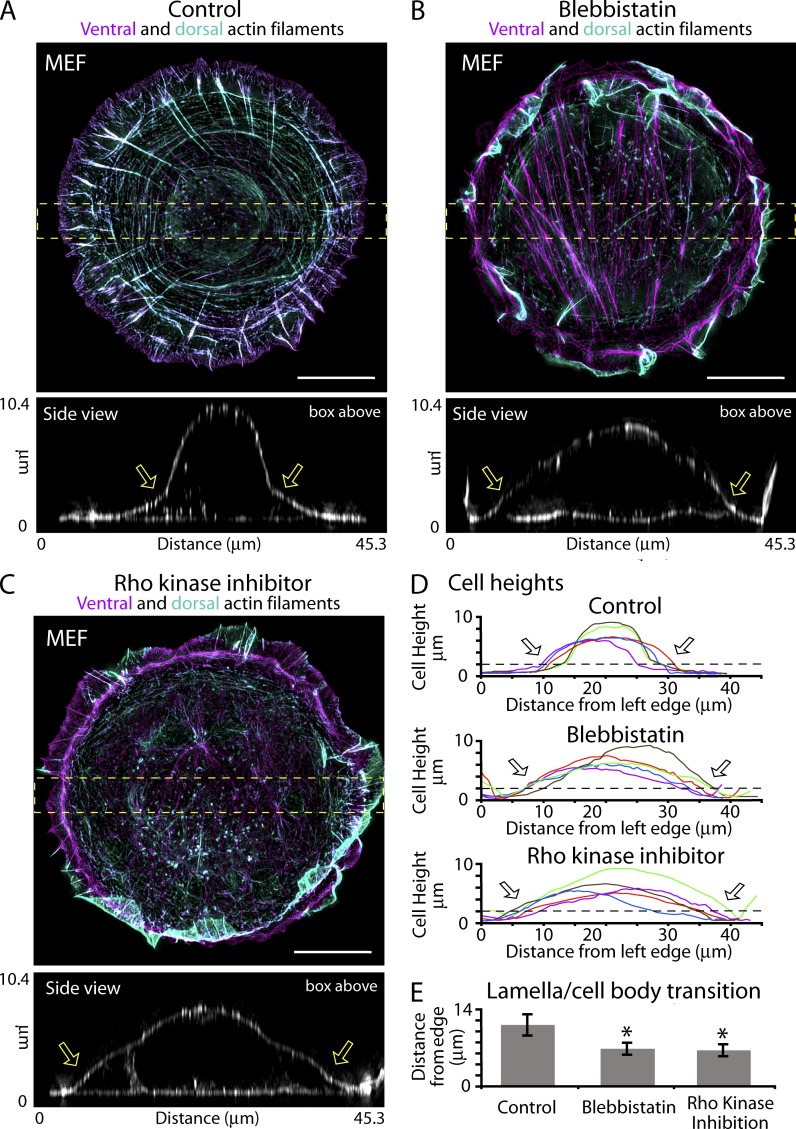
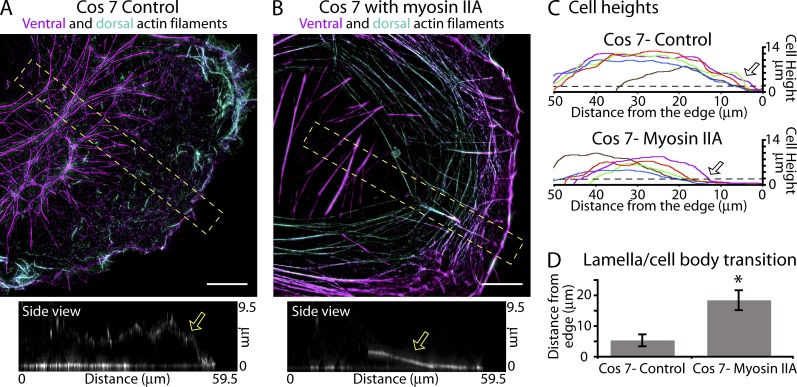
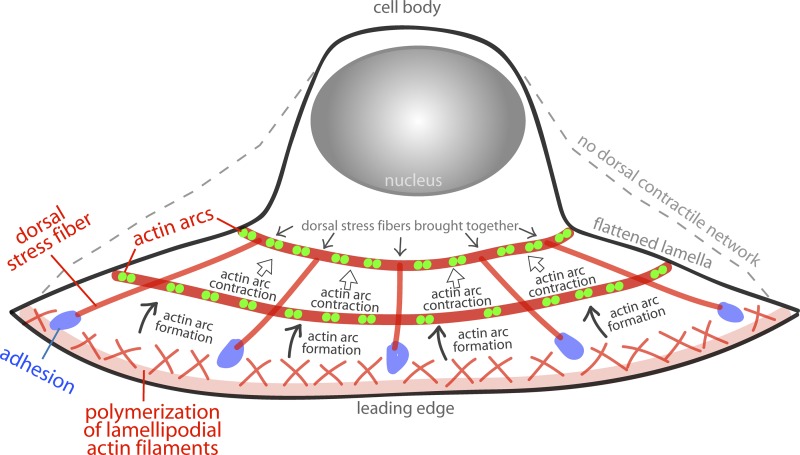
How adherent and contractile systems coordinate to promote cell shape changes is unclear. Here, we define a counterbalanced adhesion/contraction model for cell shape control. Live-cell microscopy data showed a crucial role for a contractile meshwork at the top of the cell, which is composed of actin arcs and myosin IIA filaments. The contractile actin meshwork is organized like muscle sarcomeres, with repeating myosin II filaments separated by the actin bundling protein α-actinin, and is mechanically coupled to noncontractile dorsal actin fibers that run from top to bottom in the cell. When the meshwork contracts, it pulls the dorsal fibers away from the substrate. This pulling force is counterbalanced by the dorsal fibers' attachment to focal adhesions, causing the fibers to bend downward and flattening the cell. This model is likely to be relevant for understanding how cells configure themselves to complex surfaces, protrude into tight spaces, and generate three-dimensional forces on the growth substrate under both healthy and diseased conditions.


Figures

Figure 1.
Figure 1.
Actin organization in the lamella is axially diffraction-limited. (A–C) Actin filaments localized in a U2OS cell by confocal imaging. (A and B) x-y views of projections from below (A) and above (B) the dotted white line in C. Open arrows, open arrowheads, and closed arrowheads denote actin arcs, DSF, and ventral stress fibers, respectively. Brackets denote lamella. (C) Side view of a cell from the region of interest denoted by the broken yellow lines in A and B. The broken white line shows the axially diffraction-limited layer at the bottom of the cell. Bracket denotes the lamella. Bars, 10 µm.
Figure 2.
Figure 2.
SIM can resolve actin arcs on the dorsal surface of the lamella. (A–E) 3D SIM of actin filaments in a U2OS cell. (A) Side view from the region of interest denoted by the box in B. Red dots show orientation. The bottom focal plane (purple) is similar to a total internal reflection fluorescence (TIRF) microscopy image. Subsequent 2.2-µm sections above the bottom focal plane are labeled blue, green, and orange, respectively. (B) x-y view of colored layers in A. Arrowheads denote DSFs and open arrows denote actin arcs. The closed arrow denotes actin on top of the cell body. Intensity levels of each section in A and B were normalized so that structure throughout the cell could be displayed in a single image irrespective of relative intensity. (C) Maximum projection of the ventral actin filaments from below the yellow broken line in B. (D) Maximum projection of dorsal actin filaments from above the dotted line in B. The graph plots the intensity of dorsal actin filaments (green line) against cell height (blue line) along the region from the line in B. Bars, 10 µm.
Figure 3.
Figure 3.
DSFs connect ventral and dorsal sides of the lamella. (A) Maximum projection and z sections every 330 nm from the box in Fig. 2 B showing the layers of actin structures at the edge. Open arrowheads and open arrows in A denote DSF and actin arcs, respectively. (B) Ventral, dorsal, and side views (taken from the yellow boxed region) of the actin filaments in a spreading primary MEF cell. Open arrowheads and open arrows in side view denote DSF and actin arcs, respectively. Bar, 10 µm.
Figure 4.
Figure 4.
Myosin II localizes to the dorsal surface of the lamella. (A and B) Myosin IIA localizes within actin arcs on the cell’s dorsal surface. (A) Ventral view of actin filaments (red), myosin IIA–GFP, and paxillin in a U2OS cell. Open arrowheads denote DSF, open arrows denote newly formed actin arcs, and closed arrows denote ventral stress fibers. (B) Dorsal view showing mature actin arcs (open arrow) and DSF (open arrowheads). Broken lines denote the sides of the cell and the circle denotes the position of the nucleus (N). Bar, 10 µm.
Figure 5.
Figure 5.
Nanoscale organization and dynamics of myosin II filaments in the lamella. (A–C) Motor domains and tails of myosin II filaments resolved with SIM. (A) Schematic depicting the myosin II filament with mEGFP fused to the N terminus of the heavy chain. Examples of myosin II filaments imaged with wide-field, SIM, and PALM are shown. (B) Schematic and SIM imaging of a myosin II filament labeled with mEGFP on the N terminus of the heavy chain (green) and an antibody labeling the tail domains (red). (C) Schematic and SIM imaging of myosin II filaments with mEmerald fused to the N terminus (green) and mApple fused to the C terminus (red). (D) Low magnification of a U2OS cell expressing the mEmerald/mApple construct. Bar, 10 µm. (E and F) High-magnification views of boxes 1 and 2 from D. (E) mEmerald/mApple construct incorporated into myosin II filaments in newly formed actin arcs in box 1 from D showing single filaments (black arrowhead) and stacks of filaments (white arrowhead) with their long axis parallel to the edge. (F) Mature actin arcs in box 2 from D showing that myosin II filaments exist in stacks (arrowhead) with their long axes parallel to the edge. (G) High-magnification view of an actin arc from a cell expressing α-actinin–mApple (red) and myosin IIA–mEGFP–N-terminal (green). Fig. S4 D shows the entire cell. (H) Line scan from the broken line in G showing two myosin IIA head groups (green line) alternating with α-actinin (red line). Broken lines denote one sarcomere-like unit. (I) Schematic showing sarcomere-like contraction of actin arcs. Green arrows denote myosin II walking and black arrows denote α-actinin zones coming together (i.e., contraction). (J) Montage showing the expansion of two myosin II filaments into filament stacks at the edge of a cell. (K) Montage showing that α-actinin surrounds, but does not colocalize with, expanding stacks of myosin II filaments. Bars: (B and C) 400 nm; (D–F) 2 µm; (G) 400 nm.
Figure 6.
Figure 6.
Actin arc contraction is coupled to DSFs. (A) α-Actinin–mApple speckles in a U2OS cell before and 3 min after 50 µM blebbistatin. Line 1 (arcs) and line 2 (DSF) were drawn parallel to the direction of speckle translocation. (B) Kymographs show the actin arc and an adjacent DSF flow before and after blebbistatin. (C) Actin arc and DSF translocation rates showing similar speeds before and after blebbistatin treatment (n = 3 experiments). *, P < 0.001. (D) Counterbalance model shows the arrangement of an actin arc (blue), DSF (black), and focal adhesion (gray) when a new actin arc is formed (top) and after the arc moves away from the edge (bottom). As the actin arc moves away from the edge it pulls on the dorsal side of the DSF. Because the DSF is attached to the focal adhesion, the force from actin arcs causes the DSF to bend downward and the edge of the cell to flatten. (E) 3D traction force map showing upward forces (green arrows) and downward forces (red arrows) exerted by a single U2OS cell spread out on a 2D gel (3 kPa). (F) High-magnification view of the edge of another U2OS cell with accompanying traction map. The white arrow denotes lamellipodium and yellow arrowheads denote the beginning of DSF. Bars: (A and E) 10 µm; (F) 5 µm.
Figure 7.
Figure 7.
Actin arcs/DSF play a role in flattening U2OS cells. (A–F) Removing actin arcs/DSFs abolishes the lamella’s flatness. (A–D) Ventral (purple) and dorsal (blue-green) actin filament organization in a control U2OS cell (A), a cell treated with 20 µM blebbistatin for 2 h (B), a cell treated with myosin IIA–siRNA (C), and a cell treated with 10 µM Y-27632 for 2 h (D). Side views are x-z maximum projections from the yellow boxes. Arrows denote the transition between the flat portion of the cell (lamella) and the cell body. (E) Cell heights from five cells from the treatments in A–D. Arrows show the mean distance cell height rises above 2 µm (dotted lines). (F) Quantification of the distance from the leading edge at which cells become higher than 2 µm (n = 6 cells per condition from three separate experiments). Error bars show standard deviation. *, P < 0.001. Bars, 10 µm.
Figure 8.
Figure 8.
Actin arcs/DSF play a role in flattening MEF cells. (A–C) MEF cells plated on 1,100-mm2 micropatterned circles. Ventral (purple) and dorsal (blue-green) actin filaments are shown for a control cell (A) and cells treated with 5 µM blebbistatin (B) or 10 µm Y-27632 (C) for 2 h. Side views are x-z maximum projections from the yellow boxes. Arrows denote the transition between the flat portion of the cell (lamella) and the cell body. (D) Cell heights from five cells from the treatments in A–C. Arrows show the mean distance cell height rises above 2 µm (broken lines). (E) Quantification of the distance from the leading edge at which cells become higher than 2 µm (n = 12 cells per condition from three separate experiments). Error bars show standard deviation. *, P < 0.001. Bars, 10 µm.
Figure 9.
Figure 9.
Adding actin arcs/DSFs to cells creates a flat lamella. (A and B) Ventral (purple) and dorsal (blue-green) actin filament organization in a control Cos7 cell (A) and in a Cos7 cell expressing myosin II–mApple (B). Side views are x-y maximum projections from the yellow boxes. Arrows in side views denote the height of the leading edge. (C) Heights of control Cos7 cells and those expressing myosin IIA–mApple. Arrows show the mean distance cell height rises above 2 µm (broken lines). *, P < 0.001. (D) Quantification of the distance from the leading edge at which cells become higher than 2 µm (n = 6 cells). Error bars show standard deviation. Bars, 10 µm.
Figure 10.
Figure 10.
A role for actin arc contraction in cell flattening. A diagram depicting actin arc dynamics in a crawling cell. Actin filaments in the lamellipodium are created by polymerization at the leading edge of the cell (bottom of the image). A subset of these actin filaments are condensed into the actin filament bundles that make up a new actin arc (“actin arc formation”). Myosin II loads on to the newly forming actin arc, giving the actin arc the ability to contract. Dual green dots along the actin arc denote the two motor domains of a myosin II filament as revealed by SIM imaging. An actin arc contracts through myosin II activity and shortens along its length (“actin arc contraction”), thus leading to a decrease in the circumference of the actin arc as it moves away from the edge. As its shrinks, the actin arc pulls the non-adhesion-attached ends of DSFs closer together (“dorsal stress fibers brought together”). The force the actin arc exerts on DSFs is balanced by the attachment of the DSFs to the substrate. Thus, as the actin arc pulls the DSFs together, the dorsal contractile system moves closer to the ventral side of the cell, creating a flat lamella (“flattened lamella”). The broken line depicts the shape of the cell without actin arcs or DSFs (“no dorsal contractile network”).

References

    1. Aman A., Piotrowski T. 2010. Cell migration during morphogenesis. Dev. Biol. 341:20–33 10.1016/j.ydbio.2009.11.014 - DOI - PubMed
    1. Burnette D.T., Ji L., Schaefer A.W., Medeiros N.A., Danuser G., Forscher P. 2008. Myosin II activity facilitates microtubule bundling in the neuronal growth cone neck. Dev. Cell. 15:163–169 10.1016/j.devcel.2008.05.016 - DOI - PMC - PubMed
    1. Burnette D.T., Manley S., Sengupta P., Sougrat R., Davidson M.W., Kachar B., Lippincott-Schwartz J. 2011. A role for actin arcs in the leading-edge advance of migrating cells. Nat. Cell Biol. 13:371–382 10.1038/ncb2205 - DOI - PMC - PubMed
    1. Chua J., Rikhy R., Lippincott-Schwartz J. 2009. Dynamin 2 orchestrates the global actomyosin cytoskeleton for epithelial maintenance and apical constriction. Proc. Natl. Acad. Sci. USA. 106:20770–20775 10.1073/pnas.0909812106 - DOI - PMC - PubMed
    1. Cramer L.P., Siebert M., Mitchison T.J. 1997. Identification of novel graded polarity actin filament bundles in locomoting heart fibroblasts: implications for the generation of motile force. J. Cell Biol. 136:1287–1305 10.1083/jcb.136.6.1287 - DOI - PMC - PubMed

Publication types