

Angiotensin-(1-7) recruits muscle microvasculature and enhances insulin's metabolic action via mas receptor
- PMID: 24711523
- PMCID: PMC4030711
- DOI: 10.1161/HYPERTENSIONAHA.113.03025
Angiotensin-(1-7) recruits muscle microvasculature and enhances insulin's metabolic action via mas receptor
Abstract
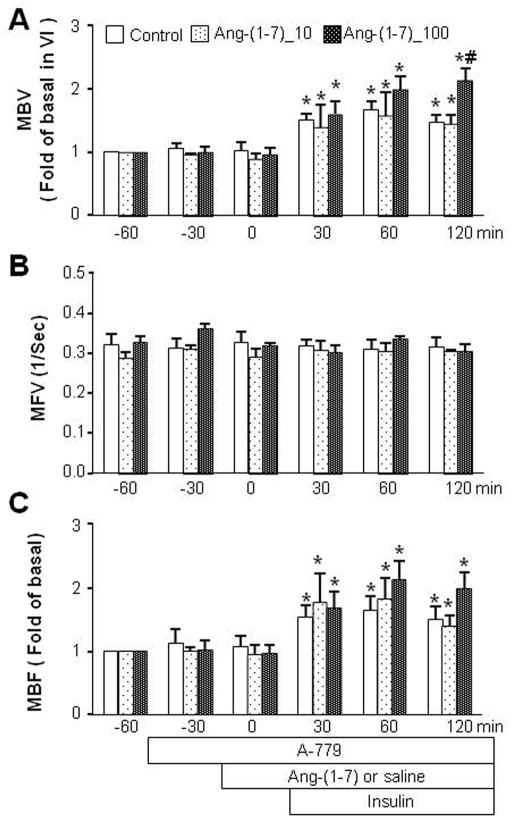
Angiotensin-(1-7) [Ang-(1-7)], an endogenous ligand for the G protein-coupled receptor Mas, exerts both vasodilatory and insulin-sensitizing effects. In skeletal muscle, relaxation of precapillary arterioles recruits microvasculature and increases the endothelial surface area available for nutrient and hormone exchanges. To assess whether Ang-(1-7) recruits microvasculature and enhances insulin action in muscle, overnight-fasted adult rats received an intravenous infusion of Ang-(1-7) (0, 10, or 100 ng/kg per minute) for 150 minutes with or without a simultaneous infusion of the Mas inhibitor A-779 and a superimposition of a euglycemic insulin clamp (3 mU/kg per minute) from 30 to 150 minutes. Hind limb muscle microvascular blood volume, microvascular flow velocity, and microvascular blood flow were determined. Myographic changes in tension were measured on preconstricted distal saphenous artery. Ang-(1-7) dose-dependently relaxed the saphenous artery (P<0.05) ex vivo. This effect was potentiated by insulin (P<0.01) and abolished by either endothelium denudement or Mas inhibition. Systemic infusion of Ang-(1-7) rapidly increased muscle microvascular blood volume and microvascular blood flow (P<0.05, each) without altering microvascular flow velocity. Insulin infusion alone increased muscle microvascular blood volume by 60% to 70% (P<0.05). Adding insulin to the Ang-(1-7) infusion further increased muscle microvascular blood volume and microvascular blood flow (≈2.5 fold; P<0.01). These were associated with a significant increase in insulin-mediated glucose disposal and muscle protein kinase B and extracellular signal-regulated kinase 1/2 phosphorylation. A-779 pretreatment blunted the microvascular and insulin-sensitizing effects of Ang-(1-7). We conclude that Ang-(1-7) by activating Mas recruits muscle microvasculature and enhances the metabolic action of insulin. These effects may contribute to the cardiovascular protective responses associated with Mas activation and explain the insulin-sensitizing action of Ang-(1-7).
Keywords: angiotensins; endothelial cells; microvasculature; muscles.
Conflict of interest statement
We declare no conflict of interest in this study.
Figures


Similar articles
-
Angiotensin II receptors modulate muscle microvascular and metabolic responses to insulin in vivo.Diabetes. 2011 Nov;60(11):2939-46. doi: 10.2337/db10-1691. Epub 2011 Sep 6. Diabetes. 2011. PMID: 21896931 Free PMC article.
-
The Mas receptor mediates modulation of insulin signaling by angiotensin-(1-7).Regul Pept. 2012 Aug 20;177(1-3):1-11. doi: 10.1016/j.regpep.2012.04.001. Epub 2012 May 1. Regul Pept. 2012. PMID: 22561450
-
Globular adiponectin enhances muscle insulin action via microvascular recruitment and increased insulin delivery.Circ Res. 2013 Apr 26;112(9):1263-71. doi: 10.1161/CIRCRESAHA.111.300388. Epub 2013 Mar 4. Circ Res. 2013. PMID: 23459195 Free PMC article.
-
Metabolic actions of angiotensin II and insulin: a microvascular endothelial balancing act.Mol Cell Endocrinol. 2013 Sep 25;378(1-2):59-69. doi: 10.1016/j.mce.2012.05.017. Epub 2012 Jun 7. Mol Cell Endocrinol. 2013. PMID: 22684034 Free PMC article. Review.
-
Muscle microvasculature's structural and functional specializations facilitate muscle metabolism.Am J Physiol Endocrinol Metab. 2016 Mar 15;310(6):E379-87. doi: 10.1152/ajpendo.00443.2015. Epub 2015 Dec 29. Am J Physiol Endocrinol Metab. 2016. PMID: 26714849 Free PMC article. Review.
Cited by
-
Vascular function, insulin action, and exercise: an intricate interplay.Trends Endocrinol Metab. 2015 Jun;26(6):297-304. doi: 10.1016/j.tem.2015.02.002. Epub 2015 Feb 23. Trends Endocrinol Metab. 2015. PMID: 25735473 Free PMC article. Review.
-
Transactivation of ErbB Family of Receptor Tyrosine Kinases Is Inhibited by Angiotensin-(1-7) via Its Mas Receptor.PLoS One. 2015 Nov 4;10(11):e0141657. doi: 10.1371/journal.pone.0141657. eCollection 2015. PLoS One. 2015. PMID: 26536590 Free PMC article.
-
Liraglutide and Exercise Synergistically Attenuate Vascular Inflammation and Enhance Metabolic Insulin Action in Early Diet-Induced Obesity.Diabetes. 2023 Jul 1;72(7):918-931. doi: 10.2337/db22-0745. Diabetes. 2023. PMID: 37074396 Free PMC article.
-
Molecular dissection of the role of ACE2 in glucose homeostasis.Physiol Rev. 2025 Jul 1;105(3):935-973. doi: 10.1152/physrev.00027.2024. Epub 2025 Feb 7. Physiol Rev. 2025. PMID: 39918873 Free PMC article. Review.
-
Angiotensin 1-7 prevents the excessive force loss resulting from 14- and 28-day denervation in mouse EDL and soleus muscle.J Gen Physiol. 2021 Dec 6;153(12):e201912556. doi: 10.1085/jgp.201912556. Epub 2021 Nov 5. J Gen Physiol. 2021. PMID: 34739541 Free PMC article.
References
-
- Vincent MA, Clerk LH, Lindner JR, Klibanov AL, Clark MG, Rattigan S, Barrett EJ. Microvascular recruitment is an early insulin effect that regulates skeletal muscle glucose uptake in vivo. Diabetes. 2004;53:1418–1423. - PubMed
-
- Clark MG, Wallis MG, Barrett EJ, Vincent MA, Richards SM, Clerk LH, Rattigan S. Blood flow and muscle metabolism: A focus on insulin action. Am J Physiol Endocrinol Metab. 2003;284:E241–258. - PubMed
-
- Carey RM, Siragy HM. Newly recognized components of the renin-angiotensin system: Potential roles in cardiovascular and renal regulation. Endocr Rev. 2003;24:261–271. - PubMed
Publication types
MeSH terms
Substances
Grants and funding
LinkOut - more resources
Full Text Sources
Other Literature Sources
Medical
Research Materials
Miscellaneous
