BIG3 inhibits insulin granule biogenesis and insulin secretion
- PMID: 24711543
- PMCID: PMC4197882
- DOI: 10.1002/embr.201338181
BIG3 inhibits insulin granule biogenesis and insulin secretion
Abstract
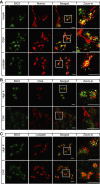
While molecular regulation of insulin granule exocytosis is relatively well understood, insulin granule biogenesis and maturation and its influence on glucose homeostasis are relatively unclear. Here, we identify a novel protein highly expressed in insulin-secreting cells and name it BIG3 due to its similarity to BIG/GBF of the Arf-GTP exchange factor (GEF) family. BIG3 is predominantly localized to insulin- and clathrin-positive trans-Golgi network (TGN) compartments. BIG3-deficient insulin-secreting cells display increased insulin content and granule number and elevated insulin secretion upon stimulation. Moreover, BIG3 deficiency results in faster processing of proinsulin to insulin and chromogranin A to β-granin in β-cells. BIG3-knockout mice exhibit postprandial hyperinsulinemia, hyperglycemia, impaired glucose tolerance, and insulin resistance. Collectively, these results demonstrate that BIG3 negatively modulates insulin granule biogenesis and insulin secretion and participates in the regulation of systemic glucose homeostasis.
Keywords: insulin granule biogenesis; insulin resistance; insulin secretion; metabolism; proinsulin processing.
© 2014 Singapore Bioimaging Consortium, A*STAR.
Figures


Similar articles
-
Detection of insulin granule exocytosis by an electrophysiology method with high temporal resolution reveals enlarged insulin granule pool in BIG3-knockout mice.Am J Physiol Endocrinol Metab. 2014 Oct 1;307(7):E611-8. doi: 10.1152/ajpendo.00208.2014. Epub 2014 Aug 19. Am J Physiol Endocrinol Metab. 2014. PMID: 25139048
-
The phosphatidylserine flippase β-subunit Tmem30a is essential for normal insulin maturation and secretion.Mol Ther. 2021 Sep 1;29(9):2854-2872. doi: 10.1016/j.ymthe.2021.04.026. Epub 2021 Apr 23. Mol Ther. 2021. PMID: 33895325 Free PMC article.
-
The Prohormone VGF Regulates β Cell Function via Insulin Secretory Granule Biogenesis.Cell Rep. 2017 Sep 5;20(10):2480-2489. doi: 10.1016/j.celrep.2017.08.050. Cell Rep. 2017. PMID: 28877479 Free PMC article.
-
Insulin granule biogenesis and exocytosis.Cell Mol Life Sci. 2021 Mar;78(5):1957-1970. doi: 10.1007/s00018-020-03688-4. Epub 2020 Nov 4. Cell Mol Life Sci. 2021. PMID: 33146746 Free PMC article. Review.
-
Biogenesis of the Insulin Secretory Granule in Health and Disease.Adv Exp Med Biol. 2019;1134:17-32. doi: 10.1007/978-3-030-12668-1_2. Adv Exp Med Biol. 2019. PMID: 30919330 Review.
Cited by
-
Increased biogenesis of glucagon-containing secretory granules and glucagon secretion in BIG3-knockout mice.Mol Metab. 2015 Jan 9;4(3):246-52. doi: 10.1016/j.molmet.2015.01.001. eCollection 2015 Mar. Mol Metab. 2015. PMID: 25737957 Free PMC article.
-
Isolation and Proteomics of the Insulin Secretory Granule.Metabolites. 2021 Apr 30;11(5):288. doi: 10.3390/metabo11050288. Metabolites. 2021. PMID: 33946444 Free PMC article. Review.
-
Characterization of the Molecular Mechanisms Underlying Glucose Stimulated Insulin Secretion from Isolated Pancreatic β-cells Using Post-translational Modification Specific Proteomics (PTMomics).Mol Cell Proteomics. 2018 Jan;17(1):95-110. doi: 10.1074/mcp.RA117.000217. Epub 2017 Nov 7. Mol Cell Proteomics. 2018. PMID: 29113996 Free PMC article.
-
Muscleblind-like 3 deficit results in a spectrum of age-associated pathologies observed in myotonic dystrophy.Sci Rep. 2016 Aug 3;6:30999. doi: 10.1038/srep30999. Sci Rep. 2016. PMID: 27484195 Free PMC article.
-
Pathways of Glucagon Secretion and Trafficking in the Pancreatic Alpha Cell: Novel Pathways, Proteins, and Targets for Hyperglucagonemia.Front Endocrinol (Lausanne). 2021 Sep 29;12:726368. doi: 10.3389/fendo.2021.726368. eCollection 2021. Front Endocrinol (Lausanne). 2021. PMID: 34659118 Free PMC article. Review.
References
-
- Saltiel AR. New perspectives into the molecular pathogenesis and treatment of type 2 diabetes. Cell. 2001;104:517–529. - PubMed
-
- Kulkarni RN. The islet beta-cell. Int J Biochem Cell Biol. 2004;36:365–371. - PubMed
-
- Hanley AJ, D’Agostino R, Jr, Wagenknecht LE, Saad MF, Savage PJ, Bergman R, Haffner SM. Increased proinsulin levels and decreased acute insulin response independently predict the incidence of type 2 diabetes in the insulin resistance atherosclerosis study. Diabetes. 2002;51:1263–1270. - PubMed
-
- Hutton JC. Insulin secretory granule biogenesis and the proinsulin-processing endopeptidases. Diabetologia. 1994;37(Suppl 2):S48–S56. - PubMed
Publication types
MeSH terms
Substances
LinkOut - more resources
Full Text Sources
Other Literature Sources
Medical
Molecular Biology Databases
Research Materials
Miscellaneous

