. 2014 May 5;211(5):961-74.
doi: 10.1084/jem.20131556. Epub 2014 Apr 7.

Type I interferons directly inhibit regulatory T cells to allow optimal antiviral T cell responses during acute LCMV infection

Affiliations

Type I interferons directly inhibit regulatory T cells to allow optimal antiviral T cell responses during acute LCMV infection

Shivani Srivastava et al. J Exp Med. .

Abstract

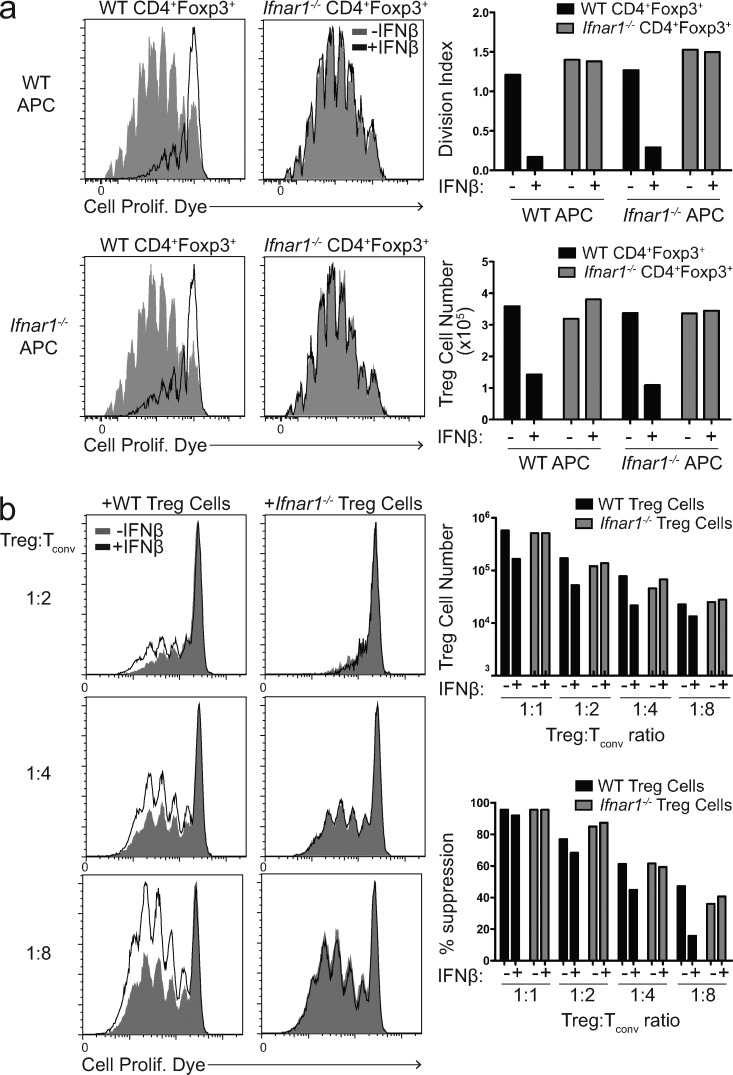
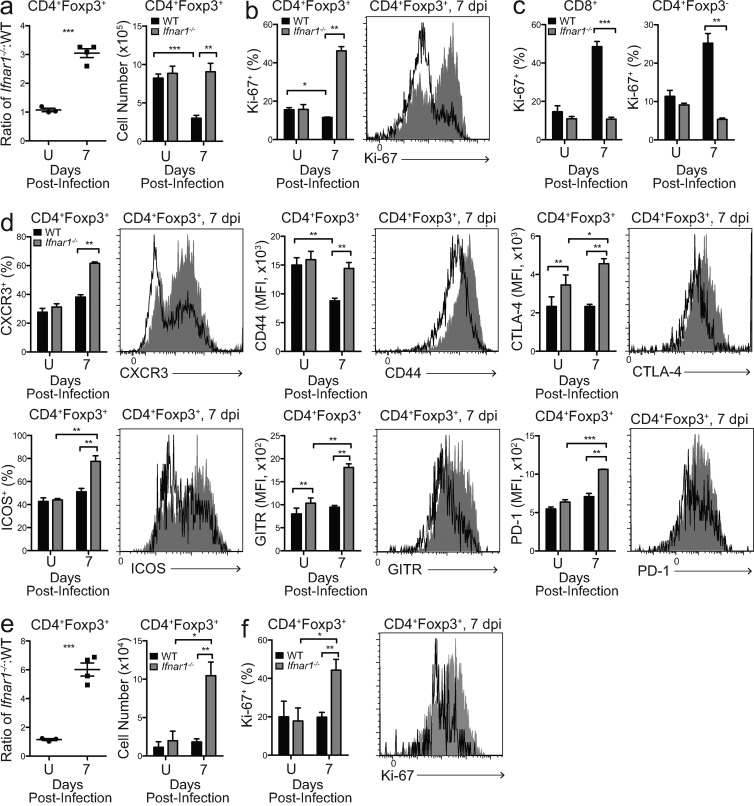
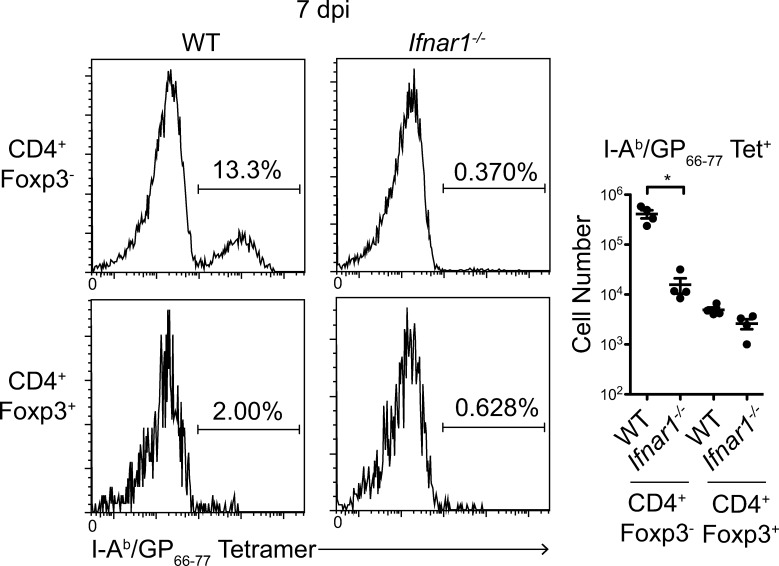
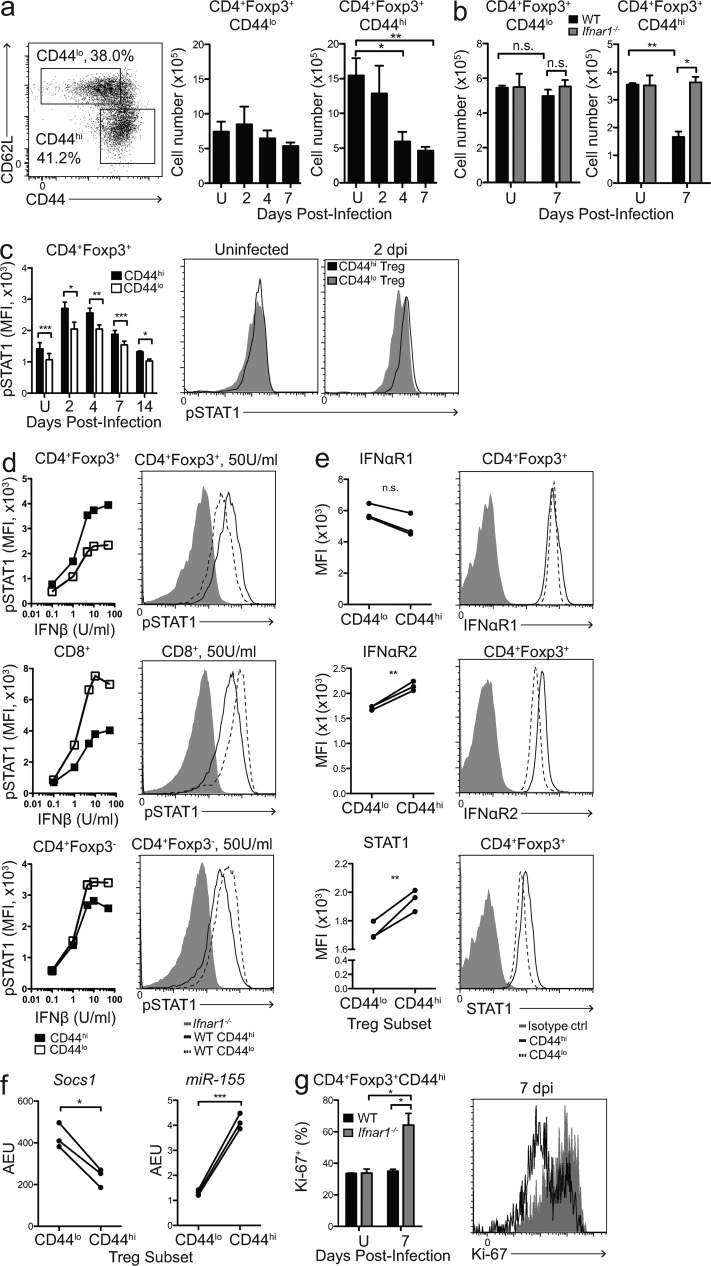
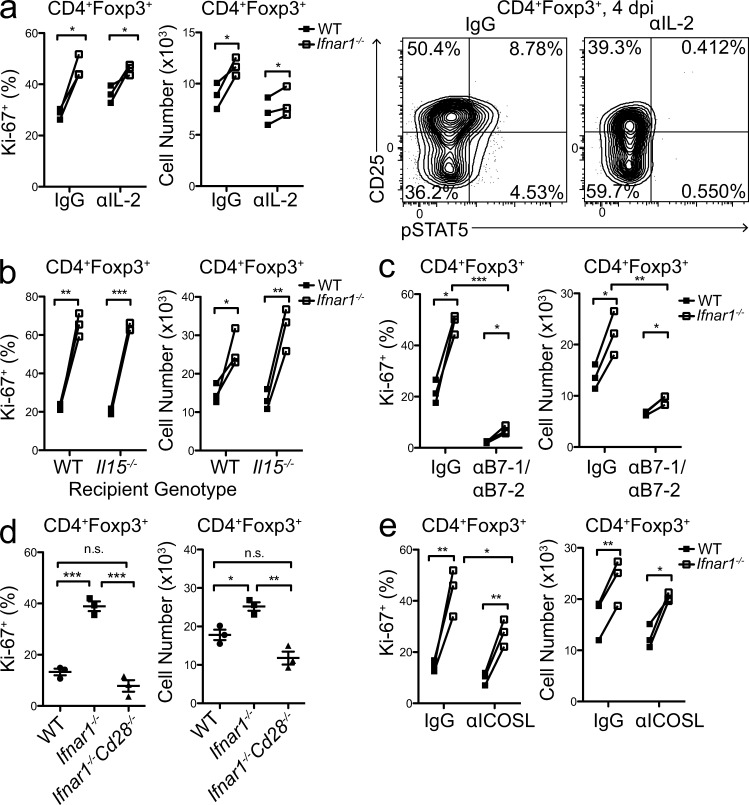
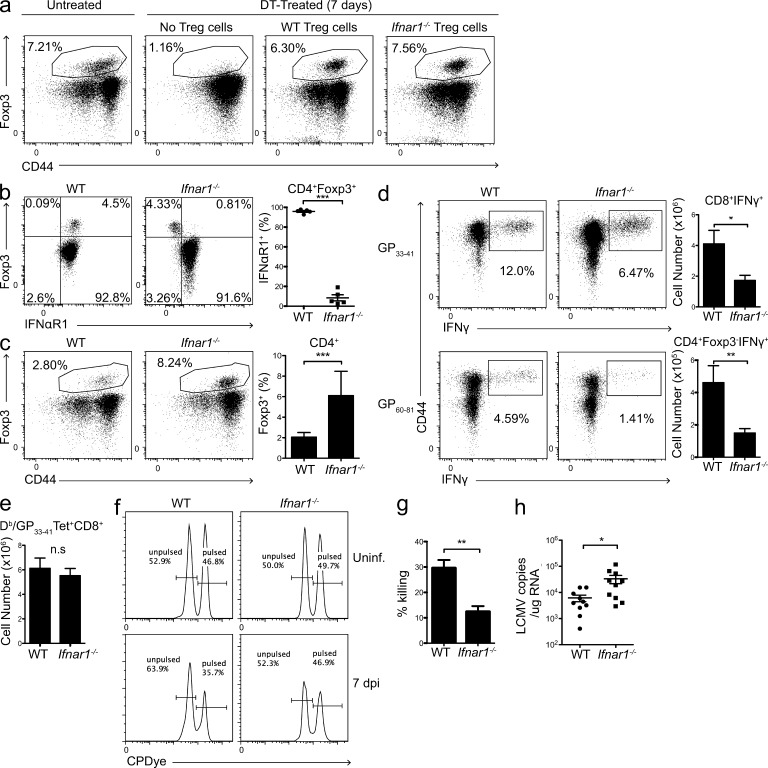
Regulatory T (T reg) cells play an essential role in preventing autoimmunity but can also impair clearance of foreign pathogens. Paradoxically, signals known to promote T reg cell function are abundant during infection and could inappropriately enhance T reg cell activity. How T reg cell function is restrained during infection to allow the generation of effective antiviral responses remains largely unclear. We demonstrate that the potent antiviral type I interferons (IFNs) directly inhibit co-stimulation-dependent T reg cell activation and proliferation, both in vitro and in vivo during acute infection with lymphocytic choriomeningitis virus (LCMV). Loss of the type I IFN receptor specifically in T reg cells results in functional impairment of virus-specific CD8(+) and CD4(+) T cells and inefficient viral clearance. Together, these data demonstrate that inhibition of T reg cells by IFNs is necessary for the generation of optimal antiviral T cell responses during acute LCMV infection.


Figures

Figure 1.
Figure 1.
T reg cells are dynamically regulated during LCMV infection. (a) Proportion of Ki-67+ cells among CD4+Foxp3+ T reg cells (left) and absolute number of CD4+Foxp3+ T reg cells (right) in spleens of mice left uninfected (U) or at various dpi with LCMV-Armstrong. (b) Proportion of Ki-67+ cells (left) and absolute number (right) of CD4+Foxp3 T cells (bottom) and CD8+ T cells (top) in spleens of mice infected with LCMV-Armstrong. (c) Fold induction of Ifnb mRNA from whole spleens of mice infected with LCMV-Armstrong relative to uninfected controls. Ifnb mRNA expression was normalized to Gapdh expression. (d) Median fluorescence intensity (MFI; top) and representative staining (bottom) of phospho-STAT1 in gated CD4+Foxp3+ T reg cells directly ex vivo from spleens of mice infected with LCMV-Armstrong. For all panels, n = 3–4 mice per group. Statistical significance was determined using one-way ANOVA with Tukey’s post-test (a–d). *, P < 0.05; **, P < 0.005; ***, P < 0.0001. Data are representative of two independent experiments with 3–4 mice per time point. All data are presented as the mean values ± SEM.
Figure 2.
Figure 2.
Type I IFNs directly inhibit T reg cell proliferation and activity in vitro. (a, Left) T reg cell proliferation assay showing CPDye dilution of gated WT (left) or Ifnar1−/− (right) CD4+Foxp3+ T reg cells cultured with WT (top) or Ifnar1−/− APCs (bottom) in the absence (gray) or presence (black) of 50 U/ml IFN-β after 72 h of culture with soluble CD3 and IL-2. (a, Right) Division index (top) and absolute number (bottom) of WT (black) or Ifnar1−/− (gray) T reg cells after 72 h of culture in the indicated conditions. (b, Left) In vitro suppression assay showing CPDye dilution of Ifnar1−/− CD4+Foxp3 Tconv cells in the presence of WT or Ifnar1−/− T reg cells at the indicated T reg/Tconv cell ratios in the absence (gray) or presence (black) of 50 U/ml IFN-β after 72 h of culture with soluble CD3 and irradiated Ifnar1−/− APCs. (b, Right) Absolute number of and percent suppression by WT (black) or Ifnar1−/− (gray) T reg cells at decreasing T reg/Tconv cell ratios after 72 h culture in the absence (−) or presence (+) of 50 U/ml IFN-β. Data are representative of 3 independent experiments.
Figure 3.
Figure 3.
Type I IFNs directly inhibit T reg cell proliferation and activity during LCMV infection. (a, Left) Ratio of Ifnar1−/−/WT CD4+Foxp3+ T reg cells in spleens of mixed bone marrow chimeric mice left uninfected or 7 dpi with LCMV Armstrong. (a, Right) Absolute number of WT (black) and Ifnar1−/− CD4+Foxp3+ T reg cells in spleens of mixed bone marrow chimeric mice left uninfected or 7 dpi. (b, Left) Summary of Ki-67 expression by WT (black) and Ifnar1−/− (gray) CD4+Foxp3+ T reg cells from spleens of mixed bone marrow chimeric mice left uninfected or 7 dpi. (b, Right) Representative flow cytometry analysis of Ki-67 expression by gated CD45.1+ WT (black) and CD45.2+ Ifnar1−/− (gray) CD4+Foxp3+ T reg cells in spleens of mixed bone marrow chimeric mice 7 dpi. (c) Summary of Ki-67 expression by WT (black) and Ifnar1−/− (gray) CD8+ and CD4+Foxp3 T cells from spleens of mixed bone marrow chimeric mice left uninfected or 7 dpi. (d) Representative flow cytometry analysis and summaries of the indicated markers expressed by WT (black) and Ifnar1−/− (gray) CD4+Foxp3+ T reg cells in spleens of mixed bone marrow chimeric mice left uninfected or 7 dpi with LCMV-Armstrong. (e, Left) Ratio of Ifnar1−/−/WT CD4+Foxp3+ T reg cells in small intestinal LP (SI-LP) of mixed bone marrow chimeric mice left uninfected or 7 dpi with LCMV Armstrong. (e, Right) Absolute number of WT (black) and Ifnar1−/− CD4+Foxp3+ T reg cells in SI-LP of mixed bone marrow chimeric mice left uninfected or 7 dpi. (f, Left) Summary of Ki-67 expression by WT (black) and Ifnar1−/− (gray) CD4+Foxp3+ T reg cells from SI-LP of mixed bone marrow chimeric mice left uninfected or 7 dpi. (f, Right) Representative flow cytometry analysis of Ki-67 expression by gated CD45.1+ WT (black) and CD45.2+ Ifnar1/− (gray) CD4+Foxp3+ T reg cells in SI-LP of mixed bone marrow chimeric mice 7 dpi. Statistical significance was determined using two-tailed paired t test when comparing WT and Ifnar1−/− cells within the same chimeric mouse. Two-tailed unpaired Student’s t test was used when comparing cells from different mice. n = 4 per group. Data are representative of 6 (a–d) or 2 (e and f) independent experiments with 3–4 mice per group. *, P < 0.05; **, P < 0.005; ***, P < 0.0001. All data are presented as the mean values ± SEM.
Figure 4.
Figure 4.
Neither WT nor Ifnar1−/− T reg cells are GP66-77 specific during LCMV infection. Left: representative histograms showing I-Ab/GP66-77 tetramer staining among gated WT (left) or Ifnar1−/− (right) CD4+Foxp3 T cells (top) and CD4+Foxp3+ T cells (bottom) from spleens of the same mixed bone marrow chimeric mouse 7 dpi with LCMV-Armstrong. Numbers represent frequency of tetramer-positive cells among the indicated populations. Right: absolute number of the indicated tetramer-positive populations in spleens of chimeric mice 7 dpi with LCMV-Armstrong. Statistical significance was determined using two-tailed paired Student’s t test. n = 4 per group. Data are representative of 2 independent experiments with 3–4 mice per group. *, P < 0.05, P < 0.0001. All data are presented as the mean values ± SEM.
Figure 5.
Figure 5.
Type I IFNs preferentially inhibit CD62LloCD44hi effector/memory T reg cells. (a, Left) Representative gating of CD44lo and CD44hi T reg cells. (a, Right) Absolute number of CD44lo and CD44hi CD4+Foxp3+ T reg cells in spleens of mice infected with LCMV-Armstrong. Data are representative of two independent experiments. n = 4 mice per group. Statistical significance was determined using one-way ANOVA with Tukey’s post-test. (b) Absolute number of CD44lo (left) and CD44hi (right) CD4+Foxp3+ T reg cells in mixed bone marrow chimeric mice left uninfected or 7 dpi. Data are representative of 6 independent experiments with 3–4 mice per group. Statistical significance was determined by two-tailed paired Student’s t test. Two-tailed unpaired Student’s t test was used when comparing cells from different mice. (c) Representative histograms (right) and MFI summary (left) of phospho-STAT1 in CD44lo (white) and CD44hi (black) T reg cells in spleens of mice infected with LCMV-Armstrong. Data are representative of two independent experiments. n = 4 mice per group. Statistical significance was determined using two-tailed paired Student’s t test. (d) Representative histograms (right) and MFI summary (left) of phospho-STAT1 in Ifnar1−/−, WT CD44lo and WT CD44hi T reg cells, CD8+, and CD4+Foxp3 T cells stimulated for 30 min with IFN-β. Data are representative of 3 independent experiments. (e) Representative histograms (right) and MFI summary (left) of IFNαR1, IFNαR2, and STAT1 in CD44lo and CD44hi CD4+Foxp3+ T reg cells determined by flow cytometry. n = 3 mice per group. Data are representative of three independent experiments. Statistical significance was determined using two-tailed paired Student’s t test. (f) miR-155 microRNA and Socs1 mRNA expression in sorted CD44lo and CD44hi CD4+Foxp3+ T reg cells, expressed in arbitrary expression units (AEUs) normalized to U6 and Gapdh expression, respectively. Data are representative of two independent experiments with three mice each. Statistical significance was determined using two-tailed paired Student’s t test. (g Left) Summary of Ki67 expression by WT and Ifnar1−/− CD4+Foxp3+CD62LloCD44hi (CD44hi) T reg cells from mixed bone marrow chimeric mice left uninfected (black) or infected with LCMV for 7 d (gray). (g, Right) Representative histogram showing Ki-67 expression by WT (black) and Ifnar1−/− (gray) CD4+Foxp3+CD62LloCD44hi T reg cells in mixed bone marrow chimeric mice 7 dpi with LCMV-Armstrong. n = 4 per group. Data are representative of 6 independent experiments. Statistical significance was determined by two-tailed paired Student’s t test. Two-tailed unpaired Student’s t test was used when comparing cells from different mice. *, P < 0.05; **, P < 0.005; ***, P < 0.0001. All data are presented as the mean values ± SEM.
Figure 6.
Figure 6.
Enhanced proliferation of Ifnar1−/− T reg cells is ICOSL- and CD28-dependent. (a, Left) Summary of Ki-67 expression and absolute number of transferred WT (black) and Ifnar1−/− (open squares) CD4+Foxp3+ T reg cells in WT mice 4 dpi with LCMV-Armstrong and treated with IgG or blocking anti–IL-2 antibody (αIL-2). (a, Right) Representative flow cytometric analysis showing pSTAT5 and CD25 expression by total CD4+Foxp3+ T reg cells in spleens of mice 4 dpi treated with IgG or αIL-2. Numbers represent frequency of the indicated quadrant among total CD4+Foxp3+ T reg cells. (b) Summary of Ki-67 expression and absolute number of transferred WT (black) and Ifnar1−/− (open squares) CD4+Foxp3+ T reg cells in WT or Il15−/− recipient mice 4 dpi with LCMV-Armstrong. (c) summary of Ki-67 expression and absolute number of transferred WT (black) and Ifnar1−/− (open squares) CD4+Foxp3+ T reg cells in WT mice 4 dpi with LCMV-Armstrong and treated with IgG or blocking anti–B7-1/B7-2 antibodies (αB7-1/B7-2). (d) Summary of Ki-67 expression and absolute number of transferred WT, Ifnar1−/−, or Ifnar1−/−Cd28−/− T reg cells in spleens of WT mice 4 dpi with LCMV-Armstrong. (e) Summary of Ki-67 expression and absolute number of transferred WT (black) and Ifnar1−/− (open squares) CD4+Foxp3+ T reg cells in WT mice 4 dpi treated with IgG or blocking anti-ICOSL antibody (αICOSL). a–c, e: statistical significance was determined using paired two-tailed Student’s t test when comparing WT and Ifnar1−/− T reg cells in the same recipient mice or unpaired two-tailed Student’s t test when comparing T reg cells in different mice. d: statistical significance was determined using one-way ANOVA with Tukey’s post-test. For all panels, n = 3 per group. Results are representative of 2 independent experiments. *, P < 0.05; **, P < 0.005; ***, P < 0.0001. All data are presented as the mean values ± SEM.
Figure 7.
Figure 7.
Inhibition of T reg cells by type I IFNs is necessary for optimal antiviral immune responses. (a) Representative flow plots showing gated CD4+ T cells from spleens of Foxp3DTR mice left untreated (left) or treated daily for 7 d with 5 µg/kg DT. DT-treated mice were reconstituted with either no T reg cells (center left), WT T reg cells (center right), or Ifnar1−/− T reg cells (right) at the start of DT treatment. Numbers represent frequency of Foxp3+ T reg cells among gated CD4+ T cells. (b) Representative flow cytometry analysis showing IFNαR1 expression on gated CD4+ T cells (left) and summary of IFNαR1 expression on CD4+Foxp3+ T reg cells (right) from peripheral blood of Foxp3DTR mice replaced with WT or Ifnar1−/− T reg cells one day before infection with LCMV. Numbers represent frequency of the indicated quadrants among total CD4+ T cells. n = 5 per group. Data are representative of three independent experiments. (c) Representative flow plots (left) and summary (right) showing frequency of Foxp3+ T reg cells among gated CD4+ T cells in WT- and Ifnar1−/−-replaced Foxp3DTR mice 7 dpi with LCMV-Armstrong. Numbers represent frequency of CD4+Foxp3+ T reg cells among total CD4+ T cells. (d, Left) Representative flow cytometric analysis of IFN-γ production by gated CD8+ T cells (top) and gated CD4+Foxp3 T cells (bottom) by intracellular cytokine staining 7 dpi in WT- and Ifnar1−/−-replaced Foxp3DTR mice after 5-h stimulation of whole splenocytes with GP33-41 (top) or GP61-80 (bottom) peptide. Numbers represent frequency of IFN-γ+ cells among CD8+ (top) and CD4+Foxp3 (bottom) T cells. (d, Right) Absolute number of LCMV peptide-specific IFN-γ+CD8+ (top) and IFN-γ+CD4+Foxp3 T cells (bottom). (e) Absolute number of CD8+ T cells staining positively for Db/GP33-41 tetramer as assessed by flow cytometry. (f) Representative flow cytometric histograms from in vivo cytotoxicity assay showing frequency of CPDyehi-labeled GP33-41 peptide-pulsed splenocytes relative to CPDyelo-labeled unpulsed splenocytes in WT- and Ifnar1−/−-replaced Foxp3DTR mice left uninfected or 7 dpi, 1 h after transfer of splenocytes. (g) Summary of percent killing of peptide-pulsed splenocytes in WT- and Ifnar1−/−-replaced Foxp3DTR mice 7 dpi. (h) LCMV GP RNA expression measured by qPCR in infected spleens and normalized to a standard curve generated using an LCMV-GP plasmid. c–e: n = 10 per group; data are summarized from 3 independent experiments. For all panels, statistical significance was determined using a two-tailed unpaired Student’s t test. *, P < 0.05; **, P < 0.005; ***, P < 0.0001. All data are presented as the mean values ± SEM.

Similar articles

Cited by

References

    1. Ahmed R., Salmi A., Butler L.D., Chiller J.M., Oldstone M.B. 1984. Selection of genetic variants of lymphocytic choriomeningitis virus in spleens of persistently infected mice. Role in suppression of cytotoxic T lymphocyte response and viral persistence. J. Exp. Med. 160:521–540 10.1084/jem.160.2.521 - DOI - PMC - PubMed
    1. Baccala R., Kono D.H., Theofilopoulos A.N. 2005. Interferons as pathogenic effectors in autoimmunity. Immunol. Rev. 204:9–26 10.1111/j.0105-2896.2005.00252.x - DOI - PubMed
    1. Belkaid Y. 2007. Regulatory T cells and infection: a dangerous necessity. Nat. Rev. Immunol. 7:875–888 10.1038/nri2189 - DOI - PubMed
    1. Belkaid Y., Tarbell K. 2009. Regulatory T cells in the control of host-microorganism interactions*. Annu. Rev. Immunol. 27:551–589 10.1146/annurev.immunol.021908.132723 - DOI - PubMed
    1. Benson A., Murray S., Divakar P., Burnaevskiy N., Pifer R., Forman J., Yarovinsky F. 2012. Microbial infection-induced expansion of effector T cells overcomes the suppressive effects of regulatory T cells via an IL-2 deprivation mechanism. J. Immunol. 188:800–810 10.4049/jimmunol.1100769 - DOI - PMC - PubMed

Publication types

MeSH terms