. 2014 May 15;192(10):4876-86.
doi: 10.4049/jimmunol.1302750. Epub 2014 Apr 7.

STAT3, STAT4, NFATc1, and CTCF regulate PD-1 through multiple novel regulatory regions in murine T cells

Affiliations

STAT3, STAT4, NFATc1, and CTCF regulate PD-1 through multiple novel regulatory regions in murine T cells

James W Austin et al. J Immunol. .

Abstract

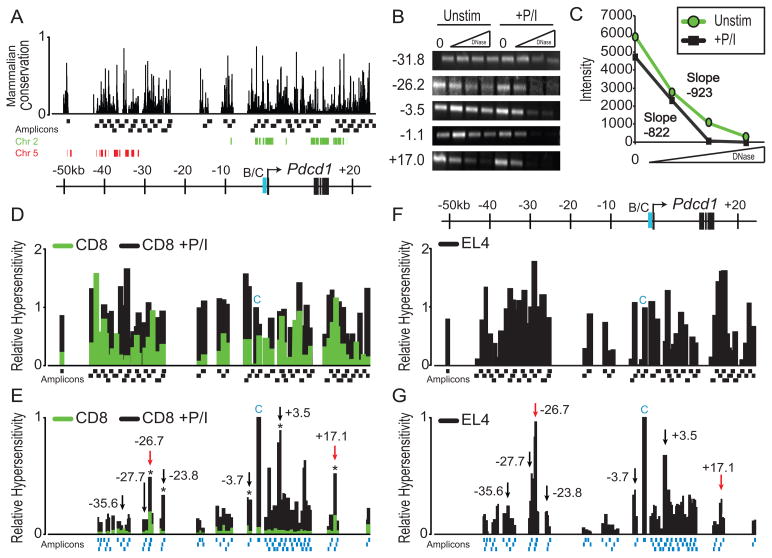
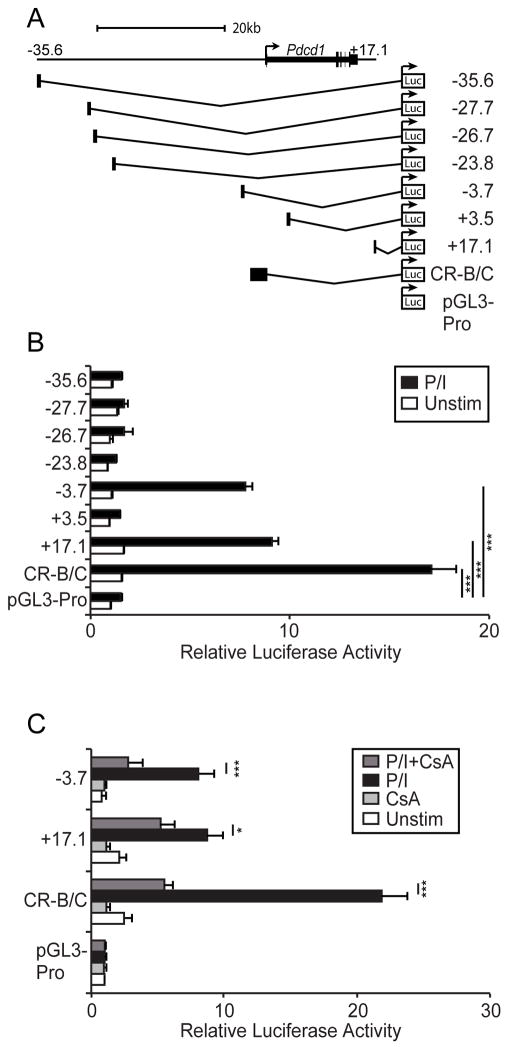
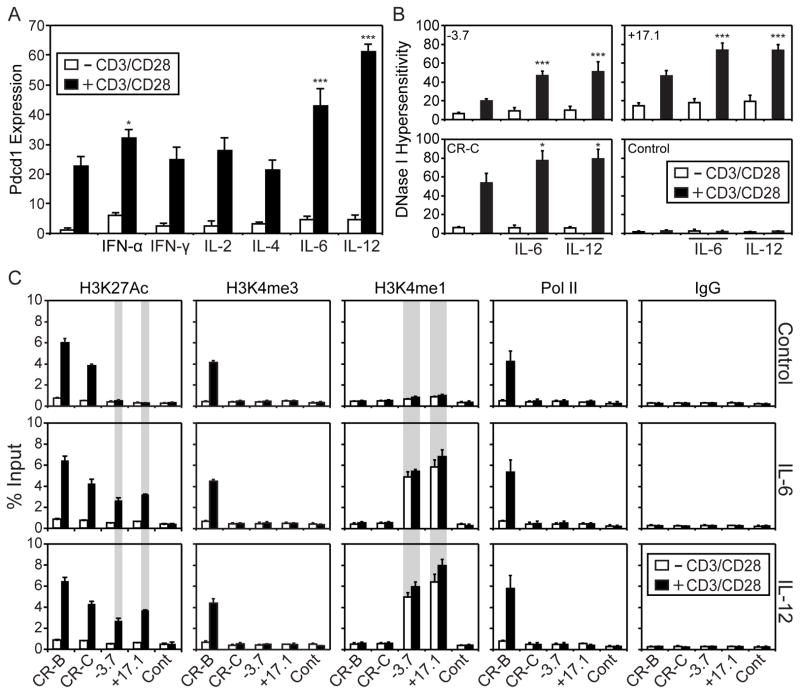
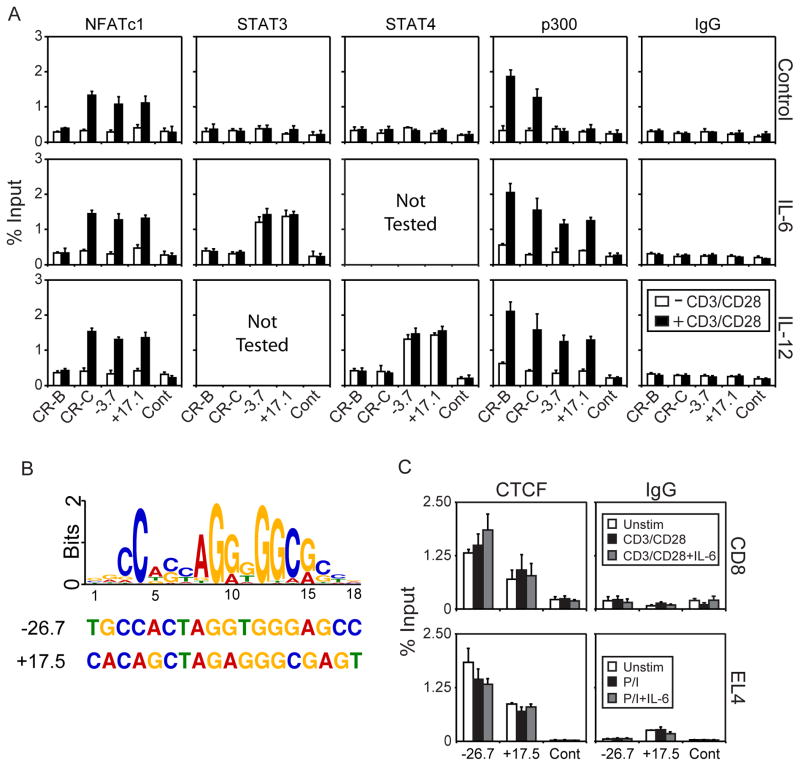
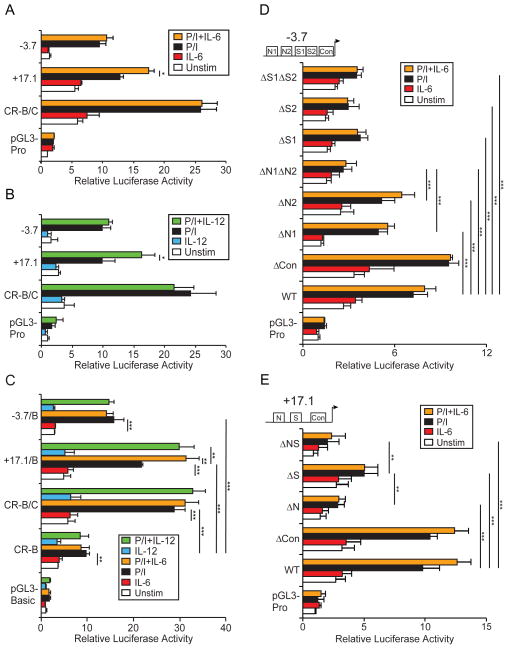
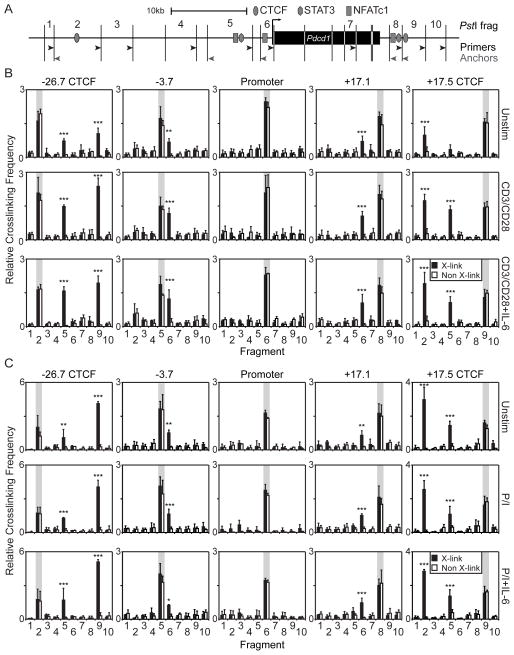
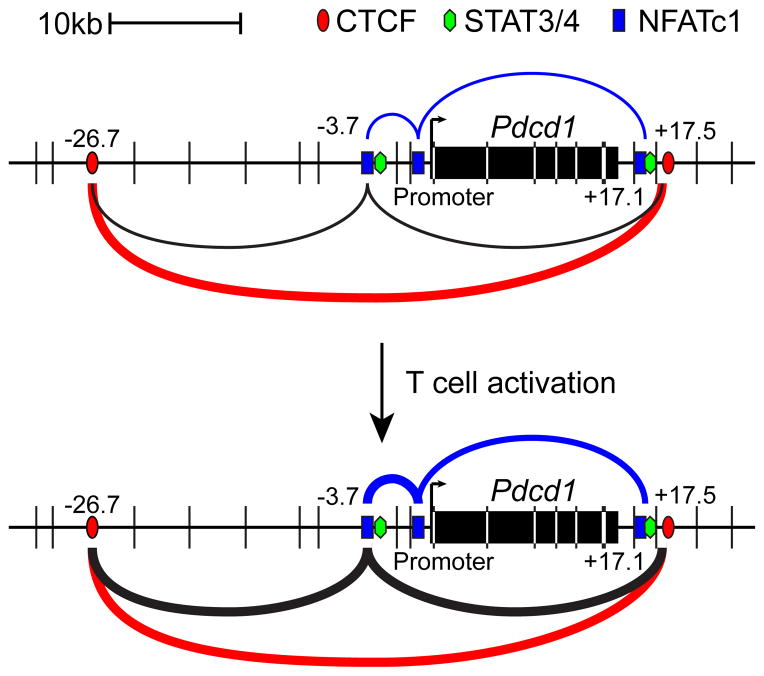
Programmed death-1 (PD-1) is a crucial negative regulator of CD8 T cell development and function, yet the mechanisms that control its expression are not fully understood. Through a nonbiased DNase I hypersensitivity assay, four novel regulatory regions within the Pdcd1 locus were identified. Two of these elements flanked the locus, bound the transcriptional insulator protein CCCTC-binding factor, and interacted with each other, creating a potential regulatory compartmentalization of the locus. In response to T cell activation signaling, NFATc1 bound to two of the novel regions that function as independent regulatory elements. STAT binding sites were identified in these elements as well. In splenic CD8 T cells, TCR-induced PD-1 expression was augmented by IL-6 and IL-12, inducers of STAT3 and STAT4 activity, respectively. IL-6 or IL-12 on its own did not induce PD-1. Importantly, STAT3/4 and distinct chromatin modifications were associated with the novel regulatory regions following cytokine stimulation. The NFATc1/STAT regulatory regions were found to interact with the promoter region of the Pdcd1 gene, providing a mechanism for their action. Together these data add multiple novel distal regulatory regions and pathways to the control of PD-1 expression and provide a molecular mechanism by which proinflammatory cytokines, such as IL-6 or IL-12, can augment PD-1 expression.


Figures

Figure 1
Figure 1. The Pdcd1 locus contains multiple inducible DNase I hypersensitive sites
(A) Schematic of the PD-1 locus showing relative positions to the TSS, conservation of sequences among mammals defined by MULTIZ alignment, and the human chain alignment of chromosome 2 (green) and 5 (red) (58, 70). Amplicons (Black boxes) used for conventional PCR-based DNase I hypersensitivity analysis are shown as is the previously defined CR-B/C regulatory region (B/C, blue). Using increasing amounts of DNase I, each of the 59 amplicons were used to assess the DNase I hypersensitivity of splenic CD8 T cells (control or stimulated with PMA and ionomycin (+P/I) ex vivo for 24h). Each PCR amplicon is between 0.9–1.3 kb in length. (B) Select examples of the 59 amplicons that were evaluated by conventional PCR are shown and their position from the TSS is indicated. (C) Each of the 59 amplicons was quantitated using ImageJ software. The bands from the +17.0 PCR shown in B were used as an example with slopes determined by linear regression. (D) Relative DNase I hypersensitivity of CD8 T cells for unstimulated (green) and PMA/Io cultured cells (black). DNase I sensitivity was calculated by taking the negative value of the slope following ImageJ quantitation and normalizing to the previously known hypersensitive region CR-C. Amplicon locations are shown below. The amplicon representing CR-C is shown with a blue C. (E) A higher resolution DNase I hypersensitivity map was constructed using real-time PCR on PMA/Io stimulated CD8 T cells. Asterisks above bars indicate regions that were chosen for further analyses that showed a statistically significant (p <0.05) increase in DNase I hypersensitivity over control samples. Black and red arrows denote regions chosen for further study and the location of these regions with respect to the TSS is indicated. The DNase I sensitivity for each of the regions indicated by the arrows was statistically significant (p <0.05). Amplicons are displayed as blue boxes along the bottom. (F) Relative hypersensitivity of the Pdcd1 locus in the murine EL4 T cell line using the same methodology as in CD8 T cells from D. (G). Quantitative real-time PCR analysis of DNase I hypersensitivity in EL4 cells using the methodology from E. The data from these experiments were averaged from three independent cell preparations.
Figure 2
Figure 2. Two novel regulatory regions respond to T cell activation
(A) DNase I hypersensitive sites selected from Figures 1E and 1G were cloned into the pGL3-Promoter firefly luciferase reporter vector. (B) Luciferase assays from EL4 cells transiently transfected with the construct indicated. Following transfection cells were cultured for 16h then stimulated with PMA/Io (P/I) for 24h. Firefly luciferase activity was quantitated, normalized to the cotransfected Renilla luciferase plasmid, and plotted relative to the empty pGL3-promoter (pGL3-Pro) vector. Data shown are the average of three independent experiments with standard deviation. Two-way ANOVA statistical tests comparing each stimulated sample to the empty vector were performed with *** representing P<0.001. (C) Constructs responding to PMA/Io were tested for their ability to respond to cyclosporine A (CsA) in transfection assays performed as above except that some cultures were treated for 2 hours with CsA prior to PMA/Io stimulation. The averages of three independent luciferase transfections were plotted. Two-way ANOVA comparing PMA/Io stimulated samples −/+ CsA were performed. ***P<0.001, *P<0.05.
Figure 3
Figure 3. IL-6 and IL-12 stimulation induces distinct chromatin modifications at Pdcd1 regulatory regions
(A) Pdcd1 mRNA expression from splenic CD8 T cells that were cultured ex vivo with CD3/CD28 bead stimulation in the presence or absence of IFN-α, IFN-γ, IL-2, IL-4, IL-6, or IL-12 for 24h was measured by real-time RT-PCR. Data is presented as the relative Pdcd1 expression normalized to 18s rRNA from three biological replicates with standard deviation. The student’s t-test was used to determine significance of activated vs. activated and cytokine treated CD8 T cells. (B) Primary splenic CD8 T cells were cultured for 24h in the presence or absence of CD3/CD28 beads, IL-6, and/or IL-12 as indicated and subsequently analyzed for DNase I hypersensitivity at −3.7, +17.1, CR-C and a control (+18.2) region. The significance of activated vs. cytokine treated, activated CD8 T cells was determined by student’s t-test. (C) Quantitative ChIP assays using antibodies against H3K27ac, H3K4me1, H3K4me3, Pol II, and a control IgG were performed from splenic CD8 T cells cultured for 24h with and without CD3/CD28 beads, IL-6, and/or IL-12 as indicated. Data were presented as the average percent chromatin input from three independent experiments. Error bars represent standard deviation. Student’s t test comparisons between control and IL-6 or IL-12 treated samples showing a significance of p<0.001 are indicated by gray shading across the ChIP samples. In the other panels p values are represented as follows: *, P<0.05; ***, P<0.001
Figure 4
Figure 4. NFATc1, STAT3, STAT4, p300, and CTCF bind to the Pdcd1 locus
Quantitative ChIP for NFATc1, STAT3, STAT4, p300 and CTCF binding to the regions indicated was performed. All ChIP data is presented as average percent input from three independent experiments with standard deviation. An IgG control antiserum was used as a specificity control for antibody binding. (A) ChIP for NFATc1, STAT3, STAT4, p300, or a control IgG from splenic CD8 T cells stimulated for 24h with CD3/CD28 beads, IL-6, and/or IL-12 as indicated. (B) Consensus CTCF binding sequence in logo format aligned with the DNA sequences from −3.7 and +17.1 is shown. (C) ChIP for CTCF or a control IgG from CD8 T cells stimulated with CD3/CD28 beads, or beads and IL-6 and EL4 cells stimulated with PMA/Io or PMA/Io (P/I) and IL-6.
Figure 5
Figure 5. NFATc1 and STAT3 binding sites are necessary for regulatory activity of the −3.7 and +17.1 regulatory regions
(A and B) EL4 cells were transfected with the indicated construct as in Figure 2 and stimulated simultaneously with PMA/Io (P/I) and/or the cytokine indicated. At 24h post stimulation, luciferase activity was determined and normalized to the cotransfected Renilla plasmid. (C) The −3.7 and +17.1 regions were cloned into the previously described Pdcd1 promoter–CR-B–pGL3-Basic–luciferase reporter expression vector (13). (D and E) NFAT and STAT binding sites identified in silico (indicated as N or S, respectively), were deleted in the pGL3-Promoter based constructs. The resulting constructs were subsequently transfected into EL4 cells and stimulated with PMA/Io and/or IL-6 as indicated. Δ indicates which sequence was deleted. ΔCon represents a random deletion and serves as a negative control. Data from three independent experiments were averaged and plotted as relative luciferase to pGL3-Promoter (pGL3-Pro) or to pGL3-Basic with standard deviation. Two-way ANOVA tests were used to determine the significance between samples. In A and B, the statistical tests compared PMA/Io stimulation to PMA/Io and IL-6; or PMA/Io stimulation to PMA/Io and IL-12. In C, PMA/Io stimulated cultures were compared to unstimulated, PMA/Io +IL-6, and PMA/Io +IL-12 cultures. PMA/Io stimulated cultures of −3.7, +17.1, and CR-B/C constructs were also compared to the PMA/Io stimulated CR-B construct. Statistical differences in D and E were assessed between the wild-type construct and the deletion constructs stimulated with PMA/Io. Additional analysis between the single and double deletion constructs were also assessed as indicated. *, P<0.05; **, P<0.01; and ***, P<0.001.
Figure 6
Figure 6. Multiple long-range interactions occur across the Pdcd1 locus
(A) Schematic of the Pdcd1 locus with CTCF, NFATc1, and STAT3 binding sites indicated. Vertical lines denote PstI sites. Arrowheads denote locations of anchors (gray) or fragment test primers (black) used in the 3C assays. (B) 3C assays of splenic CD8 T cells unstimulated or activated with CD3/CD28 beads for 24h in the presence or absence of IL-6. Anchor primers are indicated at the top of each column and fragment test primers are indicated in the abscissa. The region used as the anchor is shaded in gray. Crosslinked and non-crosslinked samples are indicated by black and white bars, respectively. (C) 3C assays were performed on EL4 cells untreated, activated with PMA/Io, or PMA/Io and IL-6 for 24h. Relative crosslinking frequency is defined as the average of the real-time PCR based values for each 3C amplicon divided by a non-specific control amplicon. Data is presented as the average relative crosslinking efficiency from three experiments plus standard deviation. Two-way ANOVA comparing crosslinked and non-crosslinked samples was performed to determine significant changes in crosslinking frequency. ***, P<0.001; **, P<.01; and *, P<0.05.
Figure 7
Figure 7. Schematic of long-range cis-element interactions at the Pdcd1 locus that occur following CD8 T cell activation
CTCF, NFATc1, and STAT3/4 binding sites are shown. PstI restriction enzyme sites are represented by vertical black lines. CTCF—CTCF (red lines), −3.7—CTCF (black lines), −3.7—Promoter (blue lines) and +17.1—Promoter (blue lines) interactions are shown with the relative strength represented by line thickness.

References

    1. Day CL, Kaufmann DE, Kiepiela P, Brown JA, Moodley ES, Reddy S, Mackey EW, Miller JD, Leslie AJ, DePierres C, Mncube Z, Duraiswamy J, Zhu B, Eichbaum Q, Altfeld M, Wherry EJ, Coovadia HM, Goulder PJR, Klenerman P, Ahmed R, Freeman GJ, Walker BD. PD-1 expression on HIV-specific T cells is associated with T-cell exhaustion and disease progression. Nature. 2006;443:350–354. - PubMed
    1. Fourcade J, Sun Z, Benallaoua M, Guillaume P, Luescher IF, Sander C, Kirkwood JM, Kuchroo V, Zarour HM. Upregulation of Tim-3 and PD-1 expression is associated with tumor antigen‚Äìspecific CD8+ T cell dysfunction in melanoma patients. The Journal of Experimental Medicine. 2010;207:2175–2186. - PMC - PubMed
    1. Wherry EJ, Ha SJ, Kaech SM, Haining WN, Sarkar S, Kalia V, Subramaniam S, Blattman JN, Barber DL, Ahmed R. Molecular Signature of CD8+ T Cell Exhaustion during Chronic Viral Infection. Immunity. 2007;27:670–684. - PubMed
    1. Akbay EA, Koyama S, Carretero J, Altabef A, Tchaicha JH, Christensen CL, Mikse OR, Cherniack AD, Beauchamp EM, Pugh TJ, Wilkerson MD, Fecci PE, Butaney M, Reibel JB, Soucheray M, Cohoon TJ, Janne PA, Meyerson M, Hayes DN, Shapiro GI, Shimamura T, Sholl LM, Rodig SJ, Freeman GJ, Hammerman PS, Dranoff G, Wong KK. Activation of the PD-1 pathway contributes to immune escape in EGFR-driven lung tumors. Cancer discovery 2013 - PMC - PubMed
    1. Zajac AJ, Blattman JN, Murali-Krishna K, Sourdive DJD, Suresh M, Altman JD, Ahmed R. Viral Immune Evasion Due to Persistence of Activated T Cells Without Effector Function. The Journal of Experimental Medicine. 1998;188:2205–2213. - PMC - PubMed

Publication types

MeSH terms